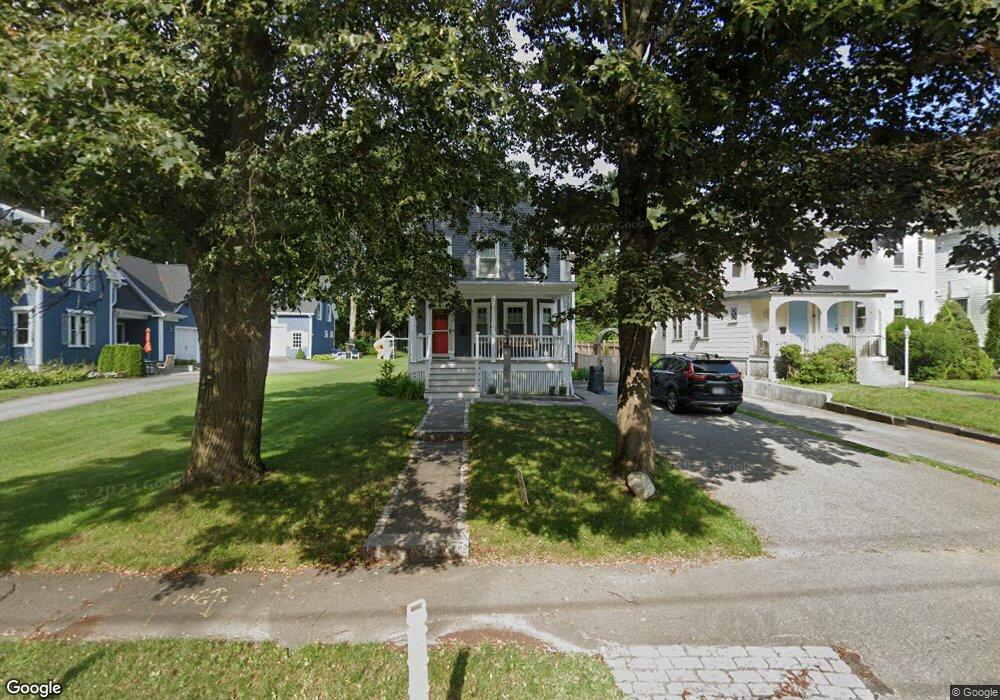
63 Maple Ave Andover, MA 01810
Shawsheen Heights NeighborhoodEstimated Value: $1,006,000 - $1,098,000
4
Beds
3
Baths
2,199
Sq Ft
$476/Sq Ft
Est. Value
About This Home
This home is located at 63 Maple Ave, Andover, MA 01810 and is currently estimated at $1,047,172, approximately $476 per square foot. 63 Maple Ave is a home located in Essex County with nearby schools including West Elementary School, Doherty Middle School, and Andover High School.
Ownership History
Date
Name
Owned For
Owner Type
Purchase Details
Closed on
Oct 29, 2010
Sold by
Fields Michael S and Fields Dianne Busby
Bought by
Schwartz Aaron L and Smith Lisa C
Current Estimated Value
Home Financials for this Owner
Home Financials are based on the most recent Mortgage that was taken out on this home.
Original Mortgage
$417,000
Outstanding Balance
$274,658
Interest Rate
4.39%
Mortgage Type
Purchase Money Mortgage
Estimated Equity
$772,514
Purchase Details
Closed on
Aug 23, 1999
Sold by
Busby Virginia A and Connolly Mary A
Bought by
Fields Michael S and Fields Dianne
Home Financials for this Owner
Home Financials are based on the most recent Mortgage that was taken out on this home.
Original Mortgage
$192,000
Interest Rate
7.6%
Mortgage Type
Purchase Money Mortgage
Create a Home Valuation Report for This Property
The Home Valuation Report is an in-depth analysis detailing your home's value as well as a comparison with similar homes in the area
Home Values in the Area
Average Home Value in this Area
Purchase History
| Date | Buyer | Sale Price | Title Company |
|---|---|---|---|
| Schwartz Aaron L | $527,500 | -- | |
| Schwartz Aaron L | $527,500 | -- | |
| Fields Michael S | $240,000 | -- | |
| Fields Michael S | $240,000 | -- |
Source: Public Records
Mortgage History
| Date | Status | Borrower | Loan Amount |
|---|---|---|---|
| Open | Schwartz Aaron L | $417,000 | |
| Closed | Fields Michael S | $417,000 | |
| Previous Owner | Fields Michael S | $185,000 | |
| Previous Owner | Fields Michael S | $30,000 | |
| Previous Owner | Fields Michael S | $192,000 |
Source: Public Records
Tax History
| Year | Tax Paid | Tax Assessment Tax Assessment Total Assessment is a certain percentage of the fair market value that is determined by local assessors to be the total taxable value of land and additions on the property. | Land | Improvement |
|---|---|---|---|---|
| 2024 | $10,748 | $834,500 | $474,300 | $360,200 |
| 2023 | $10,272 | $752,000 | $427,200 | $324,800 |
| 2022 | $9,839 | $673,900 | $378,100 | $295,800 |
| 2021 | $9,405 | $615,100 | $343,700 | $271,400 |
| 2020 | $9,012 | $600,400 | $335,400 | $265,000 |
| 2019 | $8,861 | $580,300 | $322,300 | $258,000 |
| 2018 | $8,461 | $541,000 | $304,000 | $237,000 |
| 2017 | $8,071 | $531,700 | $298,000 | $233,700 |
| 2016 | $7,880 | $531,700 | $298,000 | $233,700 |
| 2015 | $7,585 | $506,700 | $286,600 | $220,100 |
Source: Public Records
Map
Nearby Homes
- 67 High St
- 1 Sweeney Ct
- 5 Lewis St
- 2 Powder Mill Square Unit 2B
- Lot 7 Weeping Willow Dr
- 22 Railroad St Unit 407
- 33 Chestnut St Unit 2
- 50C Washington Park Dr Unit 10
- 96 N Main St Unit 3
- 100.5 Main St Unit Q
- 1 Longwood Dr Unit 105
- 16 Balmoral St Unit 214
- 3 Torr St
- 42 York St
- 354 N Main St Unit 214
- 105 Central St
- 15 Alcott Way
- 28 Stirling St
- 30 Canterbury St
- 35 Peters St
Your Personal Tour Guide
Ask me questions while you tour the home.