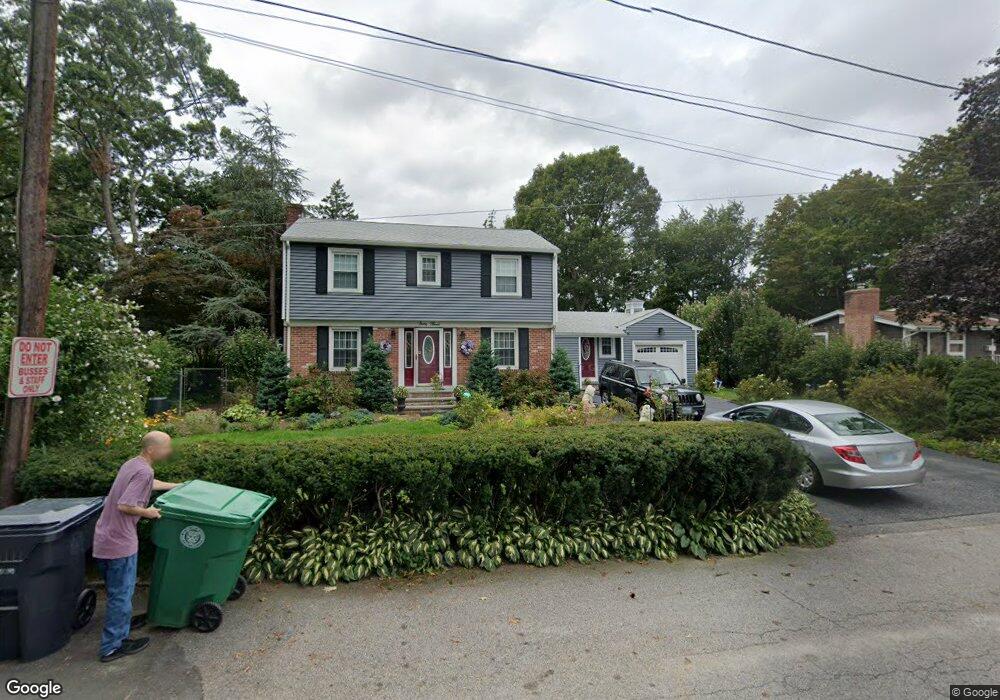
63 Mullen Rd Warwick, RI 02888
Spring Green NeighborhoodEstimated Value: $423,000 - $506,000
3
Beds
2
Baths
1,900
Sq Ft
$246/Sq Ft
Est. Value
About This Home
This home is located at 63 Mullen Rd, Warwick, RI 02888 and is currently estimated at $466,862, approximately $245 per square foot. 63 Mullen Rd is a home located in Kent County with nearby schools including St. Peter School and Saint Paul School.
Ownership History
Date
Name
Owned For
Owner Type
Purchase Details
Closed on
Jul 31, 2023
Sold by
Bonaldi Cynthia M
Bought by
Bonaldi Lee F
Current Estimated Value
Purchase Details
Closed on
Aug 24, 2000
Sold by
Gervais David J and Gervais Darleen L
Bought by
Bonaldi Cynthia M
Purchase Details
Closed on
Aug 23, 1989
Sold by
Giannini Alfred
Bought by
Gervais David J
Create a Home Valuation Report for This Property
The Home Valuation Report is an in-depth analysis detailing your home's value as well as a comparison with similar homes in the area
Home Values in the Area
Average Home Value in this Area
Purchase History
| Date | Buyer | Sale Price | Title Company |
|---|---|---|---|
| Bonaldi Lee F | -- | None Available | |
| Bonaldi Cynthia M | $160,000 | -- | |
| Gervais David J | $159,500 | -- | |
| Gervais David J | $159,500 | -- |
Source: Public Records
Mortgage History
| Date | Status | Borrower | Loan Amount |
|---|---|---|---|
| Previous Owner | Gervais David J | $129,000 | |
| Previous Owner | Gervais David J | $140,000 | |
| Previous Owner | Gervais David J | $143,000 |
Source: Public Records
Tax History
| Year | Tax Paid | Tax Assessment Tax Assessment Total Assessment is a certain percentage of the fair market value that is determined by local assessors to be the total taxable value of land and additions on the property. | Land | Improvement |
|---|---|---|---|---|
| 2025 | $5,098 | $401,400 | $111,700 | $289,700 |
| 2024 | $4,947 | $341,900 | $97,100 | $244,800 |
| 2023 | $4,852 | $341,900 | $97,100 | $244,800 |
| 2022 | $4,754 | $253,800 | $60,800 | $193,000 |
| 2021 | $4,754 | $253,800 | $60,800 | $193,000 |
| 2020 | $4,754 | $253,800 | $60,800 | $193,000 |
| 2019 | $4,754 | $253,800 | $60,800 | $193,000 |
| 2018 | $4,166 | $200,300 | $54,000 | $146,300 |
| 2017 | $4,054 | $200,300 | $54,000 | $146,300 |
| 2016 | $4,054 | $200,300 | $54,000 | $146,300 |
| 2015 | $4,351 | $209,700 | $72,600 | $137,100 |
| 2014 | $4,207 | $209,700 | $72,600 | $137,100 |
| 2013 | $4,150 | $209,700 | $72,600 | $137,100 |
Source: Public Records
Map
Nearby Homes
- 821 Post Rd
- 63 Benbridge Ave
- 1052 Post Rd
- 80 George St
- 1020 Warwick Ave
- 15 Christopher Rhodes Way
- 6 Christopher Rhodes Way
- 136 Sherwood Ave
- 120 Sherwood Ave
- 127 Sherwood Ave
- 111 Sherwood Ave
- 171 Sherwood Ave
- 213 Easton Ave
- 25 Newfield Ave
- 39 Holiday Ave
- 35 Welfare Ave
- 20 Commodore Ave
- 0 Elmwood Ave
- 56 Errol St
- 123 Harrington Ave
Your Personal Tour Guide
Ask me questions while you tour the home.