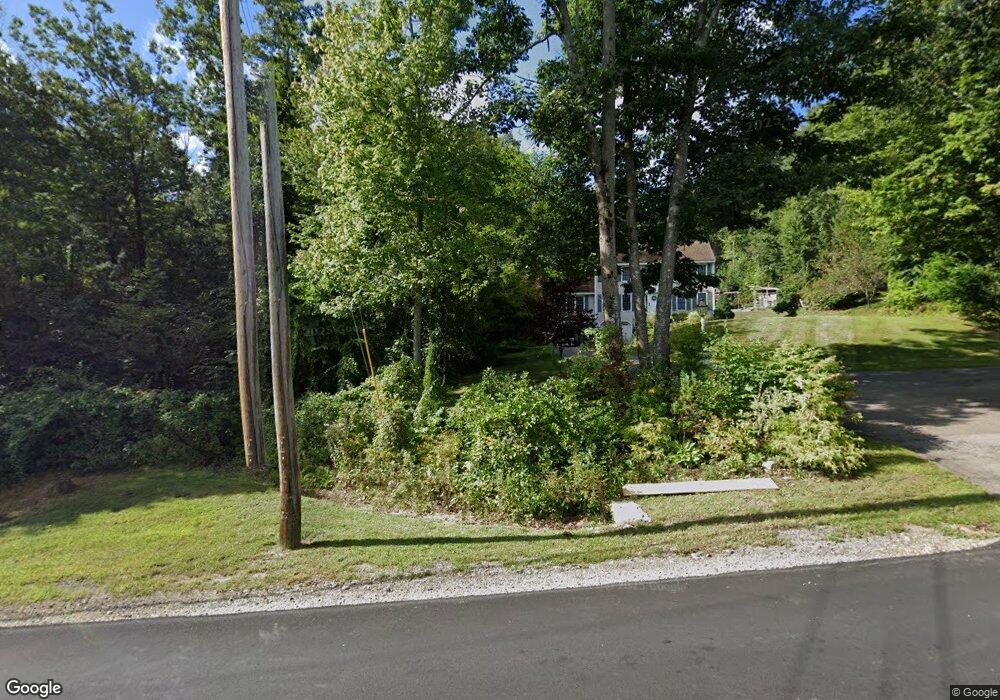
63 Pine St Hooksett, NH 03106
Estimated Value: $540,000 - $636,884
3
Beds
3
Baths
1,896
Sq Ft
$315/Sq Ft
Est. Value
About This Home
This home is located at 63 Pine St, Hooksett, NH 03106 and is currently estimated at $597,221, approximately $314 per square foot. 63 Pine St is a home located in Merrimack County with nearby schools including Fred C. Underhill School, Hooksett Memorial School, and David R. Cawley Middle School.
Ownership History
Date
Name
Owned For
Owner Type
Purchase Details
Closed on
Nov 1, 2006
Sold by
Preston Brian P and Preston Yvonne M
Bought by
Johnson Marie C
Current Estimated Value
Home Financials for this Owner
Home Financials are based on the most recent Mortgage that was taken out on this home.
Original Mortgage
$232,000
Interest Rate
6.47%
Purchase Details
Closed on
Jul 11, 2000
Sold by
Stackhouse Peter
Bought by
Preston Brian P and Preston Yvonne M
Create a Home Valuation Report for This Property
The Home Valuation Report is an in-depth analysis detailing your home's value as well as a comparison with similar homes in the area
Home Values in the Area
Average Home Value in this Area
Purchase History
| Date | Buyer | Sale Price | Title Company |
|---|---|---|---|
| Johnson Marie C | $290,000 | -- | |
| Johnson Marie C | -- | -- | |
| Preston Brian P | $196,000 | -- |
Source: Public Records
Mortgage History
| Date | Status | Borrower | Loan Amount |
|---|---|---|---|
| Open | Preston Brian P | $100,000 | |
| Open | Preston Brian P | $163,000 | |
| Closed | Preston Brian P | $191,000 | |
| Closed | Johnson Marie C | $232,000 |
Source: Public Records
Tax History
| Year | Tax Paid | Tax Assessment Tax Assessment Total Assessment is a certain percentage of the fair market value that is determined by local assessors to be the total taxable value of land and additions on the property. | Land | Improvement |
|---|---|---|---|---|
| 2024 | $9,584 | $565,100 | $144,600 | $420,500 |
| 2023 | $9,030 | $565,100 | $144,600 | $420,500 |
| 2022 | $7,951 | $330,600 | $98,000 | $232,600 |
| 2021 | $7,346 | $330,600 | $98,000 | $232,600 |
| 2020 | $12,318 | $303,600 | $98,000 | $205,600 |
| 2019 | $6,543 | $303,600 | $98,000 | $205,600 |
| 2018 | $6,823 | $303,600 | $98,000 | $205,600 |
| 2017 | $6,779 | $253,500 | $90,200 | $163,300 |
| 2016 | $13,218 | $253,500 | $90,200 | $163,300 |
| 2015 | $14,034 | $253,500 | $90,200 | $163,300 |
| 2014 | $6,294 | $253,500 | $90,200 | $163,300 |
| 2013 | $5,952 | $253,500 | $90,200 | $163,300 |
Source: Public Records
Map
Nearby Homes
Your Personal Tour Guide
Ask me questions while you tour the home.