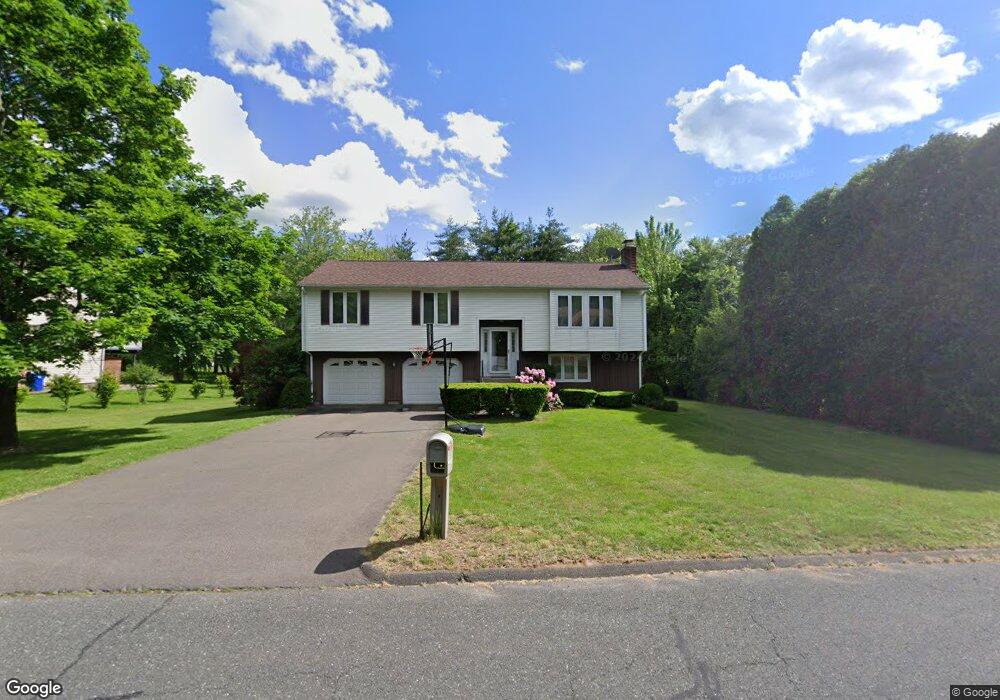
63 Regency Dr Windsor, CT 06095
West Windsor NeighborhoodEstimated Value: $335,000 - $403,000
3
Beds
3
Baths
1,258
Sq Ft
$287/Sq Ft
Est. Value
About This Home
This home is located at 63 Regency Dr, Windsor, CT 06095 and is currently estimated at $361,290, approximately $287 per square foot. 63 Regency Dr is a home located in Hartford County with nearby schools including Poquonock Elementary School, Clover Street School, and Sage Park Middle School.
Ownership History
Date
Name
Owned For
Owner Type
Purchase Details
Closed on
Nov 8, 2006
Sold by
Strong Richard
Bought by
Bembry Gregory and Bembry Cynthia
Current Estimated Value
Home Financials for this Owner
Home Financials are based on the most recent Mortgage that was taken out on this home.
Original Mortgage
$217,200
Outstanding Balance
$135,864
Interest Rate
7.35%
Mortgage Type
Purchase Money Mortgage
Estimated Equity
$225,426
Create a Home Valuation Report for This Property
The Home Valuation Report is an in-depth analysis detailing your home's value as well as a comparison with similar homes in the area
Home Values in the Area
Average Home Value in this Area
Purchase History
| Date | Buyer | Sale Price | Title Company |
|---|---|---|---|
| Bembry Gregory | $271,500 | -- |
Source: Public Records
Mortgage History
| Date | Status | Borrower | Loan Amount |
|---|---|---|---|
| Open | Bembry Gregory | $217,200 | |
| Closed | Bembry Gregory | $54,300 | |
| Previous Owner | Bembry Gregory | $28,000 |
Source: Public Records
Tax History
| Year | Tax Paid | Tax Assessment Tax Assessment Total Assessment is a certain percentage of the fair market value that is determined by local assessors to be the total taxable value of land and additions on the property. | Land | Improvement |
|---|---|---|---|---|
| 2025 | $6,166 | $216,720 | $55,930 | $160,790 |
| 2024 | $6,571 | $216,720 | $55,930 | $160,790 |
| 2023 | $4,539 | $135,100 | $39,410 | $95,690 |
| 2022 | $4,527 | $136,080 | $39,410 | $96,670 |
| 2021 | $4,527 | $136,080 | $39,410 | $96,670 |
| 2020 | $4,506 | $136,080 | $39,410 | $96,670 |
| 2019 | $4,406 | $136,080 | $39,410 | $96,670 |
| 2018 | $4,416 | $133,980 | $39,410 | $94,570 |
| 2017 | $4,266 | $131,460 | $39,410 | $92,050 |
| 2016 | $4,144 | $131,460 | $39,410 | $92,050 |
| 2015 | $4,065 | $131,460 | $39,410 | $92,050 |
| 2014 | $4,006 | $131,460 | $39,410 | $92,050 |
Source: Public Records
Map
Nearby Homes
- 73 Abbey Ln
- 76 Lincoln Way
- 2 Sandra Dr
- 60 Nod Rd
- 23 Farmstead Cir
- 27 April Way
- 1130 Blue Hills Ave
- 932 Worthy St
- 25 Matthew Ln
- 1035 N Worthy St
- 2 Camelot Dr Unit 4
- 38 Sutton Place Unit 38
- 961 Windsor Ave
- 31 Sutton Place
- 747 Blue Hills Ave
- 18 Darby St
- 97 E Burnham St
- 58 Amanda Cir
- 159 School St
- 27 Fyler Dr
Your Personal Tour Guide
Ask me questions while you tour the home.