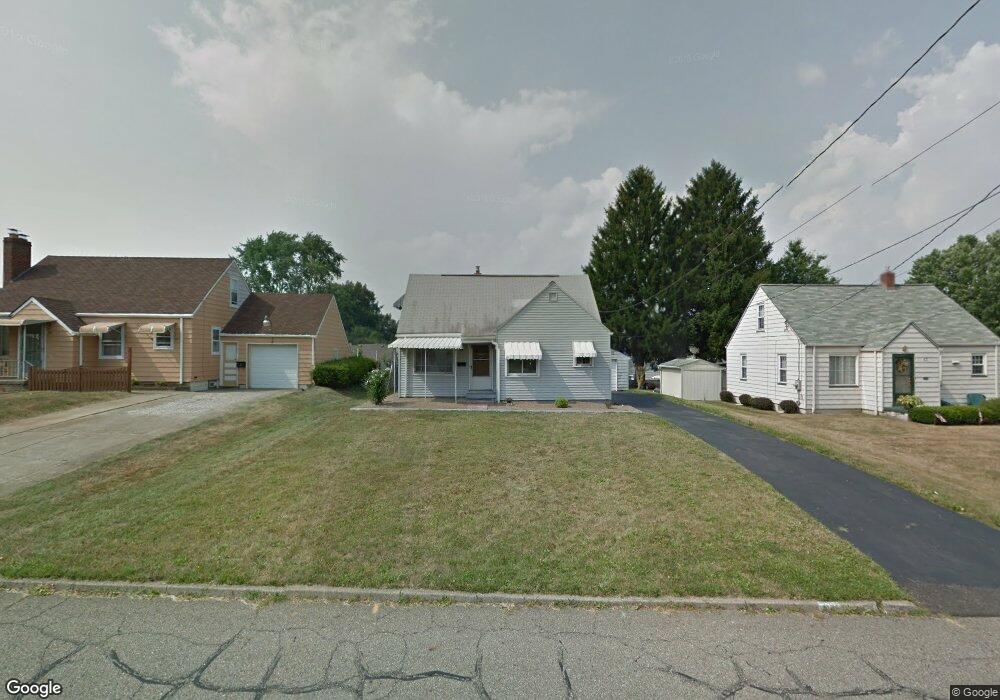
63 Renee Dr Struthers, OH 44471
Estimated Value: $70,000 - $150,000
3
Beds
2
Baths
1,144
Sq Ft
$105/Sq Ft
Est. Value
About This Home
This home is located at 63 Renee Dr, Struthers, OH 44471 and is currently estimated at $119,837, approximately $104 per square foot. 63 Renee Dr is a home located in Mahoning County with nearby schools including Struthers Elementary School, Struthers Middle School, and Struthers High School.
Ownership History
Date
Name
Owned For
Owner Type
Purchase Details
Closed on
Nov 12, 2025
Sold by
Balestra Zachary D
Bought by
Kotayo Home Limited
Current Estimated Value
Purchase Details
Closed on
Oct 25, 2019
Sold by
Balestra Joseph D and Balestra Joyce A
Bought by
Balestra Zachary D
Purchase Details
Closed on
Jul 30, 2010
Sold by
Secretary Of Housing & Urban Development
Bought by
Balestra Joseph D and Balestra Joyce A
Purchase Details
Closed on
Mar 1, 2010
Sold by
Pnc Mortgage
Bought by
The Secretary Of Housing & Urban Develop
Purchase Details
Closed on
Feb 25, 2010
Sold by
Lind Curt
Bought by
Pnc Mortgage
Purchase Details
Closed on
Oct 12, 2004
Sold by
Johnston Kenneth W and Johnston Monica F
Bought by
Lind Curt
Home Financials for this Owner
Home Financials are based on the most recent Mortgage that was taken out on this home.
Original Mortgage
$77,343
Interest Rate
5.89%
Mortgage Type
FHA
Purchase Details
Closed on
Jan 31, 1983
Bought by
Johnston Ken W and Johnston Monica F
Create a Home Valuation Report for This Property
The Home Valuation Report is an in-depth analysis detailing your home's value as well as a comparison with similar homes in the area
Home Values in the Area
Average Home Value in this Area
Purchase History
We collect this data history from publicly available records. To have your information removed, we recommend requesting removal directly through your county’s website.
| Date | Buyer | Sale Price | Title Company |
|---|---|---|---|
| Kotayo Home Limited | $70,000 | None Listed On Document | |
| Balestra Zachary D | $31,600 | None Available | |
| Balestra Joseph D | $40,600 | Attorney | |
| The Secretary Of Housing & Urban Develop | -- | Attorney | |
| Pnc Mortgage | $46,000 | None Available | |
| Lind Curt | $78,000 | -- | |
| Johnston Ken W | -- | -- |
Source: Public Records
Mortgage History
We collect this data history from publicly available records. To have your information removed, we recommend requesting removal directly through your county’s website.
| Date | Status | Borrower | Loan Amount |
|---|---|---|---|
| Previous Owner | Lind Curt | $77,343 |
Source: Public Records
Tax History
| Year | Tax Paid | Tax Assessment Tax Assessment Total Assessment is a certain percentage of the fair market value that is determined by local assessors to be the total taxable value of land and additions on the property. | Land | Improvement |
|---|---|---|---|---|
| 2025 | $1,083 | $26,000 | $4,320 | $21,680 |
| 2024 | $1,084 | $26,000 | $4,320 | $21,680 |
| 2023 | $1,065 | $26,000 | $4,320 | $21,680 |
| 2022 | $688 | $12,690 | $4,070 | $8,620 |
| 2021 | $681 | $12,690 | $4,070 | $8,620 |
| 2020 | $684 | $12,690 | $4,070 | $8,620 |
| 2019 | $673 | $11,040 | $3,540 | $7,500 |
| 2018 | $643 | $11,040 | $3,540 | $7,500 |
| 2017 | $829 | $11,040 | $3,540 | $7,500 |
| 2016 | $1,017 | $17,990 | $4,120 | $13,870 |
| 2015 | $994 | $17,990 | $4,120 | $13,870 |
| 2014 | $998 | $17,990 | $4,120 | $13,870 |
| 2013 | $930 | $17,990 | $4,120 | $13,870 |
Source: Public Records
Map
Nearby Homes
Your Personal Tour Guide
Ask me questions while you tour the home.