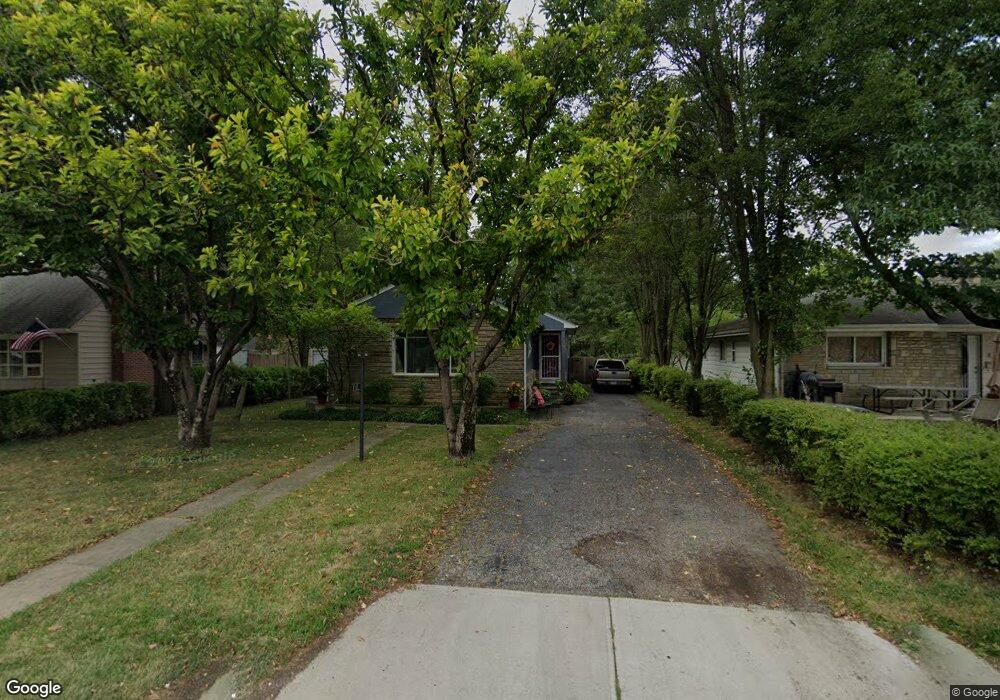
63 S James Rd Columbus, OH 43213
Eastmoor NeighborhoodEstimated Value: $296,000 - $353,552
4
Beds
3
Baths
1,678
Sq Ft
$188/Sq Ft
Est. Value
About This Home
This home is located at 63 S James Rd, Columbus, OH 43213 and is currently estimated at $314,888, approximately $187 per square foot. 63 S James Rd is a home located in Franklin County with nearby schools including Fairmoor Elementary School, Johnson Park Middle School, and Walnut Ridge High School.
Ownership History
Date
Name
Owned For
Owner Type
Purchase Details
Closed on
Jan 6, 2018
Sold by
Michael Linda and Williams Rodney D
Bought by
Michael Linda and Michael Linda R
Current Estimated Value
Purchase Details
Closed on
May 30, 2000
Sold by
Shayani Siamak
Bought by
Rodney Michael Linda and Rodney William
Home Financials for this Owner
Home Financials are based on the most recent Mortgage that was taken out on this home.
Original Mortgage
$115,286
Outstanding Balance
$38,166
Interest Rate
8.18%
Mortgage Type
FHA
Estimated Equity
$276,722
Purchase Details
Closed on
May 13, 1997
Sold by
Gallagher Richard D
Bought by
Mizraei Shayani Mansour and Mizraei Zadeh Gity
Purchase Details
Closed on
Feb 20, 1990
Create a Home Valuation Report for This Property
The Home Valuation Report is an in-depth analysis detailing your home's value as well as a comparison with similar homes in the area
Home Values in the Area
Average Home Value in this Area
Purchase History
| Date | Buyer | Sale Price | Title Company |
|---|---|---|---|
| Michael Linda | -- | None Available | |
| Rodney Michael Linda | $118,700 | Foundation Title Agency Inc | |
| Mizraei Shayani Mansour | $78,000 | -- | |
| -- | $71,500 | -- |
Source: Public Records
Mortgage History
| Date | Status | Borrower | Loan Amount |
|---|---|---|---|
| Open | Rodney Michael Linda | $115,286 |
Source: Public Records
Tax History
| Year | Tax Paid | Tax Assessment Tax Assessment Total Assessment is a certain percentage of the fair market value that is determined by local assessors to be the total taxable value of land and additions on the property. | Land | Improvement |
|---|---|---|---|---|
| 2025 | $4,632 | $103,220 | $41,900 | $61,320 |
| 2024 | $4,632 | $103,220 | $41,900 | $61,320 |
| 2023 | $4,573 | $103,215 | $41,895 | $61,320 |
| 2022 | $3,596 | $69,340 | $20,340 | $49,000 |
| 2021 | $3,603 | $69,340 | $20,340 | $49,000 |
| 2020 | $3,607 | $69,340 | $20,340 | $49,000 |
| 2019 | $3,383 | $55,760 | $16,280 | $39,480 |
| 2018 | $2,869 | $55,760 | $16,280 | $39,480 |
| 2017 | $3,381 | $55,760 | $16,280 | $39,480 |
| 2016 | $2,602 | $39,280 | $6,830 | $32,450 |
| 2015 | $2,362 | $39,280 | $6,830 | $32,450 |
| 2014 | $2,368 | $39,280 | $6,830 | $32,450 |
| 2013 | $1,168 | $39,270 | $6,825 | $32,445 |
Source: Public Records
Map
Nearby Homes
- 3191 E Broad St
- 181 S Kellner Rd
- 228 S Ashburton Rd
- 177 S Hampton Rd
- 73 N Everett Ave
- 279 S Ashburton Rd
- 277 S James Rd
- 50 N Hampton Rd
- 73 N Hampton Rd
- 157 N Kellner Rd
- 50 S Chesterfield Rd
- 181 S Weyant Ave
- 290 S Hampton Rd
- 194 N Kellner Rd
- 68 S Weyant Ave
- 180 N Harding Rd
- 281 S Weyant Ave
- 238 Edgevale Rd
- 350 S Hampton Rd
- 253 N James Rd
- 57 S James Rd
- 71 S James Rd
- 79 S James Rd
- 49 S James Rd
- 58 S Kellner Rd
- 66 S Kellner Rd
- 74 S Kellner Rd
- 89 S James Rd
- 89 N James Rd
- 40 S Kellner Rd
- 68 S James Rd
- 33 S James Rd
- 60 S James Rd
- 80 S James Rd
- 80 S James Rd Unit 5
- 52 S James Rd
- 28 S Kellner Rd
- 46 S James Ro
- 46 S James Rd Unit A
- 46 S James Rd
Your Personal Tour Guide
Ask me questions while you tour the home.