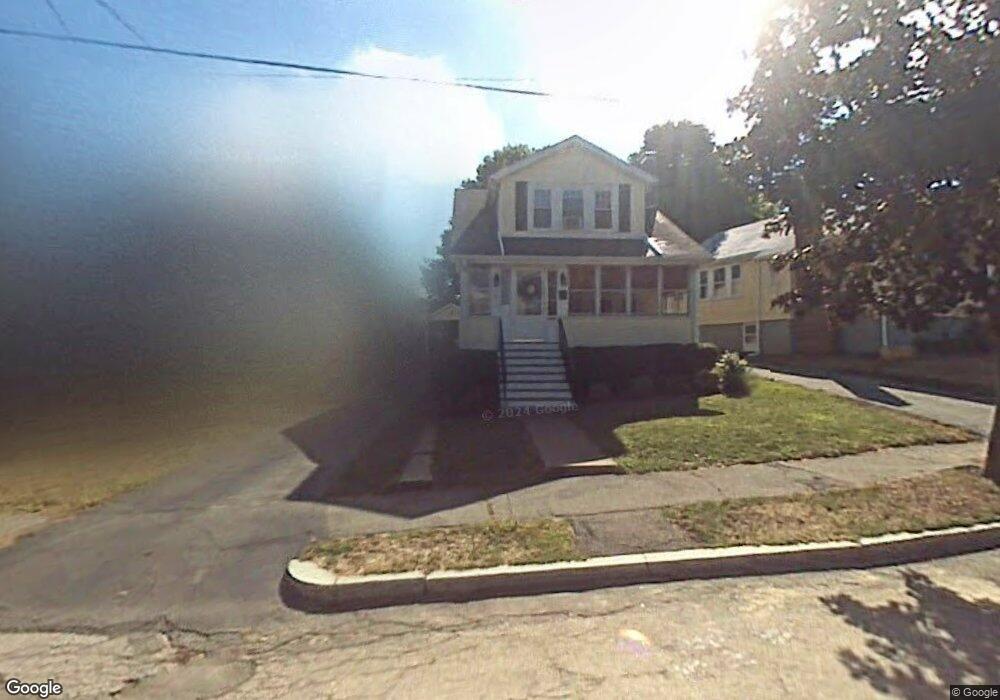
63 Sherman St Quincy, MA 02170
West Quincy NeighborhoodEstimated Value: $589,981 - $677,000
2
Beds
1
Bath
1,019
Sq Ft
$618/Sq Ft
Est. Value
About This Home
This home is located at 63 Sherman St, Quincy, MA 02170 and is currently estimated at $629,245, approximately $617 per square foot. 63 Sherman St is a home located in Norfolk County with nearby schools including Montclair Elementary School, Atlantic Middle School, and North Quincy High School.
Ownership History
Date
Name
Owned For
Owner Type
Purchase Details
Closed on
Aug 25, 2025
Sold by
Mcdonough Karen
Bought by
Karen Mcdonough Ret and Mcdonough
Current Estimated Value
Purchase Details
Closed on
Jun 1, 2022
Sold by
Mcdonough Karen A and First American Natl Llc
Bought by
First American Natl Llc
Purchase Details
Closed on
Jul 28, 2005
Sold by
Moscaritolo Christine A and Obrien David M
Bought by
Mcdonough Karen A
Home Financials for this Owner
Home Financials are based on the most recent Mortgage that was taken out on this home.
Original Mortgage
$292,000
Interest Rate
5.67%
Mortgage Type
Purchase Money Mortgage
Purchase Details
Closed on
Apr 19, 2002
Sold by
Green Ft
Bought by
Moscaritolo Christine and Obrien David M
Home Financials for this Owner
Home Financials are based on the most recent Mortgage that was taken out on this home.
Original Mortgage
$229,200
Interest Rate
6.85%
Mortgage Type
Purchase Money Mortgage
Create a Home Valuation Report for This Property
The Home Valuation Report is an in-depth analysis detailing your home's value as well as a comparison with similar homes in the area
Home Values in the Area
Average Home Value in this Area
Purchase History
| Date | Buyer | Sale Price | Title Company |
|---|---|---|---|
| Karen Mcdonough Ret | -- | -- | |
| First American Natl Llc | $178,500 | None Available | |
| Mcdonough Karen A | $365,000 | -- | |
| Mcdonough Karen A | $365,000 | -- | |
| Moscaritolo Christine | $286,500 | -- | |
| Moscaritolo Christine | $286,500 | -- |
Source: Public Records
Mortgage History
| Date | Status | Borrower | Loan Amount |
|---|---|---|---|
| Previous Owner | Mcdonough Karen A | $292,000 | |
| Previous Owner | Mcdonough Karen A | $73,000 | |
| Previous Owner | Moscaritolo Christine | $229,200 |
Source: Public Records
Tax History
| Year | Tax Paid | Tax Assessment Tax Assessment Total Assessment is a certain percentage of the fair market value that is determined by local assessors to be the total taxable value of land and additions on the property. | Land | Improvement |
|---|---|---|---|---|
| 2025 | $6,127 | $531,400 | $314,700 | $216,700 |
| 2024 | $5,967 | $529,500 | $314,700 | $214,800 |
| 2023 | $5,573 | $500,700 | $299,800 | $200,900 |
| 2022 | $5,365 | $447,800 | $260,700 | $187,100 |
| 2021 | $5,201 | $428,400 | $248,300 | $180,100 |
| 2020 | $5,158 | $415,000 | $248,300 | $166,700 |
| 2019 | $4,753 | $378,700 | $232,000 | $146,700 |
| 2018 | $4,744 | $355,600 | $214,800 | $140,800 |
| 2017 | $4,822 | $340,300 | $204,600 | $135,700 |
| 2016 | $4,495 | $313,000 | $177,900 | $135,100 |
| 2015 | $4,107 | $281,300 | $161,700 | $119,600 |
| 2014 | $3,828 | $257,600 | $154,000 | $103,600 |
Source: Public Records
Map
Nearby Homes
- 281 Elmwood Ave
- 30 Elmwood Park
- 17 Albany St
- 134 Sherman St
- 138 Sherman St
- 169 Pine St
- 17 Bunton St
- 475 Beale St
- 0 Franklin St
- 271 Holbrook Rd
- 267-269 Farrington St
- 41 Wallace Rd
- 98 Safford St
- 440 Granite Ave Unit 201
- 85 Hilma St
- 149 Reservoir Rd
- 54 Safford St
- 115 W Squantum St Unit 816
- 115 W Squantum St Unit 607
- 115 W Squantum St Unit 517
Your Personal Tour Guide
Ask me questions while you tour the home.