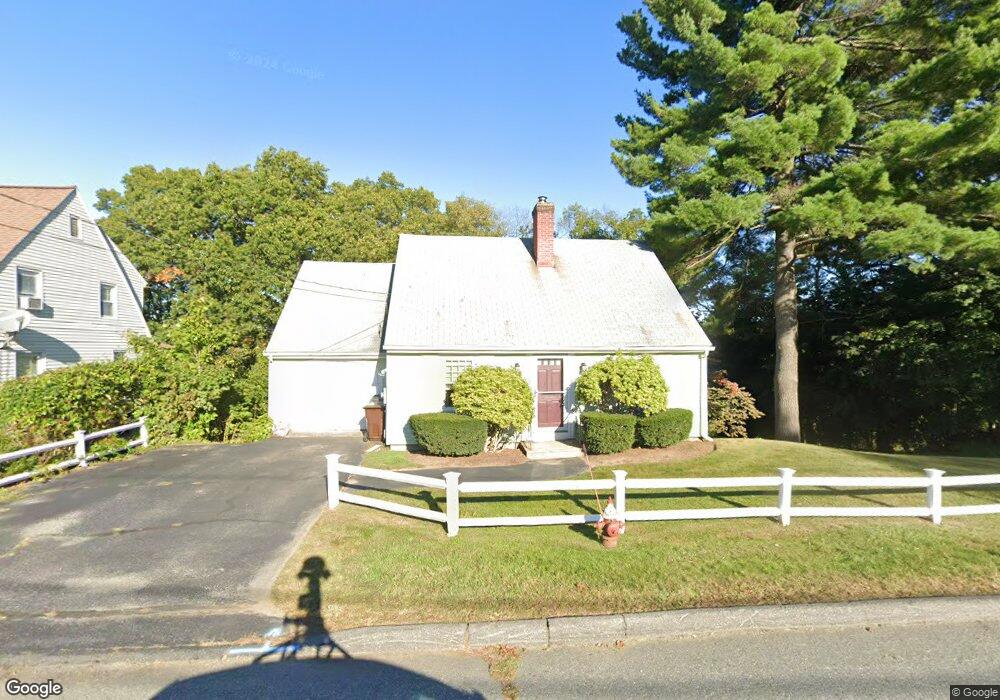
63 Sumner St Auburn, MA 01501
Stoneville NeighborhoodEstimated Value: $375,142 - $453,000
2
Beds
2
Baths
1,391
Sq Ft
$299/Sq Ft
Est. Value
About This Home
This home is located at 63 Sumner St, Auburn, MA 01501 and is currently estimated at $416,036, approximately $299 per square foot. 63 Sumner St is a home located in Worcester County with nearby schools including Auburn Senior High School, Canterbury Street School, and Shrewsbury Montessori School - Auburn Campus.
Ownership History
Date
Name
Owned For
Owner Type
Purchase Details
Closed on
Aug 9, 1996
Sold by
Latif Edward A
Bought by
Quinn Peter M and Jones Patrick L
Current Estimated Value
Home Financials for this Owner
Home Financials are based on the most recent Mortgage that was taken out on this home.
Original Mortgage
$70,300
Interest Rate
8.24%
Mortgage Type
Purchase Money Mortgage
Create a Home Valuation Report for This Property
The Home Valuation Report is an in-depth analysis detailing your home's value as well as a comparison with similar homes in the area
Home Values in the Area
Average Home Value in this Area
Purchase History
| Date | Buyer | Sale Price | Title Company |
|---|---|---|---|
| Quinn Peter M | $74,100 | -- |
Source: Public Records
Mortgage History
| Date | Status | Borrower | Loan Amount |
|---|---|---|---|
| Open | Quinn Peter M | $75,000 | |
| Closed | Quinn Peter M | $70,300 |
Source: Public Records
Tax History
| Year | Tax Paid | Tax Assessment Tax Assessment Total Assessment is a certain percentage of the fair market value that is determined by local assessors to be the total taxable value of land and additions on the property. | Land | Improvement |
|---|---|---|---|---|
| 2025 | $44 | $309,700 | $114,500 | $195,200 |
| 2024 | $4,436 | $297,100 | $108,900 | $188,200 |
| 2023 | $4,359 | $274,500 | $99,000 | $175,500 |
| 2022 | $4,102 | $243,900 | $99,000 | $144,900 |
| 2021 | $3,809 | $210,000 | $87,300 | $122,700 |
| 2020 | $3,689 | $205,200 | $87,300 | $117,900 |
| 2019 | $3,538 | $192,100 | $86,400 | $105,700 |
| 2018 | $3,415 | $185,200 | $80,800 | $104,400 |
| 2017 | $3,198 | $174,400 | $73,300 | $101,100 |
| 2016 | $3,126 | $172,800 | $77,000 | $95,800 |
| 2015 | $2,972 | $172,200 | $77,000 | $95,200 |
| 2014 | $2,886 | $166,900 | $73,200 | $93,700 |
Source: Public Records
Map
Nearby Homes
- 5 Commonwealth Ave
- 177 Boyce St
- 25 Vinal St Unit 28
- 25 Vinal St Unit 26
- 25 Vinal St Unit 29
- 25 Vinal St Unit 30
- 99 Clover St
- 1 Rockland Road Ct
- 177 Oxford St N
- 204-212 Hampton St
- 31-33 Walsh Ave
- 33 Walsh Ave
- 31 Walsh Ave
- 11 Hulbert Rd Unit 13
- 40 Bryn Mawr Ave
- 19-20 Williams St
- 154 Pakachoag St
- 1034 Southbridge St
- 6 Buron Terrace
- 27 Havana Rd
Your Personal Tour Guide
Ask me questions while you tour the home.