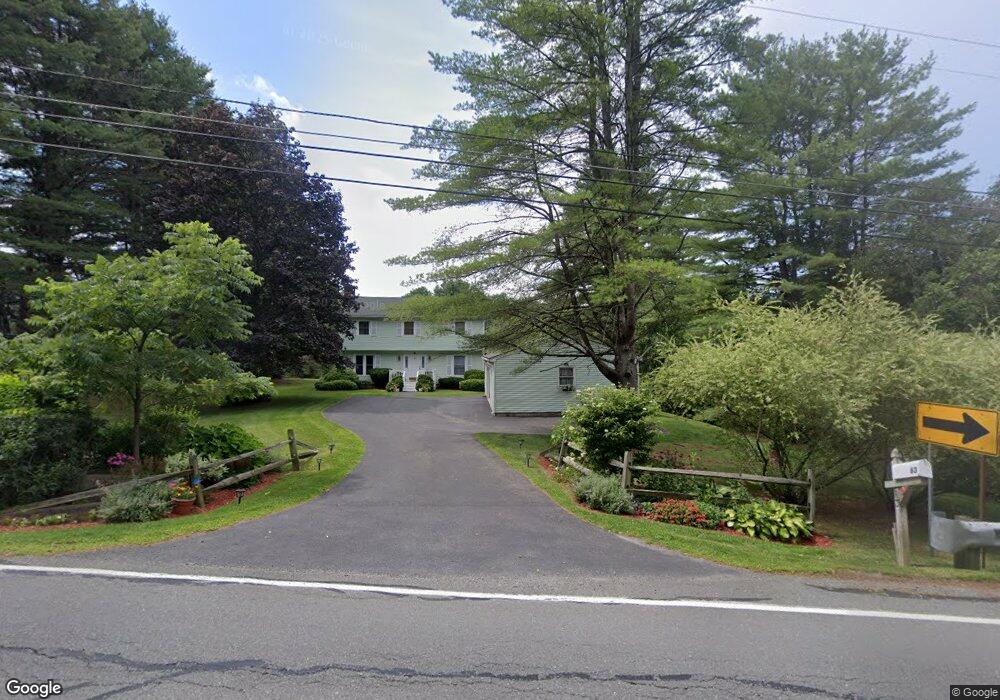
63 Swamp Rd West Stockbridge, MA 01266
Estimated Value: $573,829 - $721,000
4
Beds
3
Baths
1,909
Sq Ft
$337/Sq Ft
Est. Value
About This Home
This home is located at 63 Swamp Rd, West Stockbridge, MA 01266 and is currently estimated at $643,207, approximately $336 per square foot. 63 Swamp Rd is a home located in Berkshire County with nearby schools including Muddy Brook Regional Elementary School, W.E.B Du Bois Regional Middle School, and Monument Mountain Regional High School.
Ownership History
Date
Name
Owned For
Owner Type
Purchase Details
Closed on
Feb 13, 2007
Sold by
Kantor Lorrin
Bought by
Krouss Andrew B and Kantor Lorrin
Current Estimated Value
Home Financials for this Owner
Home Financials are based on the most recent Mortgage that was taken out on this home.
Original Mortgage
$150,000
Interest Rate
6.22%
Mortgage Type
Purchase Money Mortgage
Purchase Details
Closed on
Feb 9, 2001
Sold by
Tremblay Wayne R and Tremblay Suzanne
Bought by
Kantor Lorrin
Create a Home Valuation Report for This Property
The Home Valuation Report is an in-depth analysis detailing your home's value as well as a comparison with similar homes in the area
Home Values in the Area
Average Home Value in this Area
Purchase History
| Date | Buyer | Sale Price | Title Company |
|---|---|---|---|
| Krouss Andrew B | -- | -- | |
| Kantor Lorrin | $210,000 | -- |
Source: Public Records
Mortgage History
| Date | Status | Borrower | Loan Amount |
|---|---|---|---|
| Open | Kantor Lorrin | $607,500 | |
| Closed | Kantor Lorrin | $152,000 | |
| Closed | Krouss Andrew B | $150,000 |
Source: Public Records
Tax History Compared to Growth
Tax History
| Year | Tax Paid | Tax Assessment Tax Assessment Total Assessment is a certain percentage of the fair market value that is determined by local assessors to be the total taxable value of land and additions on the property. | Land | Improvement |
|---|---|---|---|---|
| 2025 | $5,583 | $580,400 | $129,000 | $451,400 |
| 2024 | $5,234 | $546,300 | $110,300 | $436,000 |
| 2023 | $4,798 | $465,400 | $105,000 | $360,400 |
| 2022 | $4,223 | $336,200 | $105,000 | $231,200 |
| 2021 | $4,468 | $321,200 | $104,800 | $216,400 |
| 2020 | $4,214 | $321,200 | $104,800 | $216,400 |
| 2019 | $3,205 | $322,500 | $104,800 | $217,700 |
| 2018 | $3,912 | $322,500 | $104,800 | $217,700 |
| 2017 | $4,025 | $322,500 | $104,800 | $217,700 |
| 2016 | $3,976 | $322,500 | $104,800 | $217,700 |
| 2015 | $3,818 | $322,500 | $104,800 | $217,700 |
| 2014 | $3,637 | $327,100 | $104,800 | $222,300 |
Source: Public Records
Map
Nearby Homes