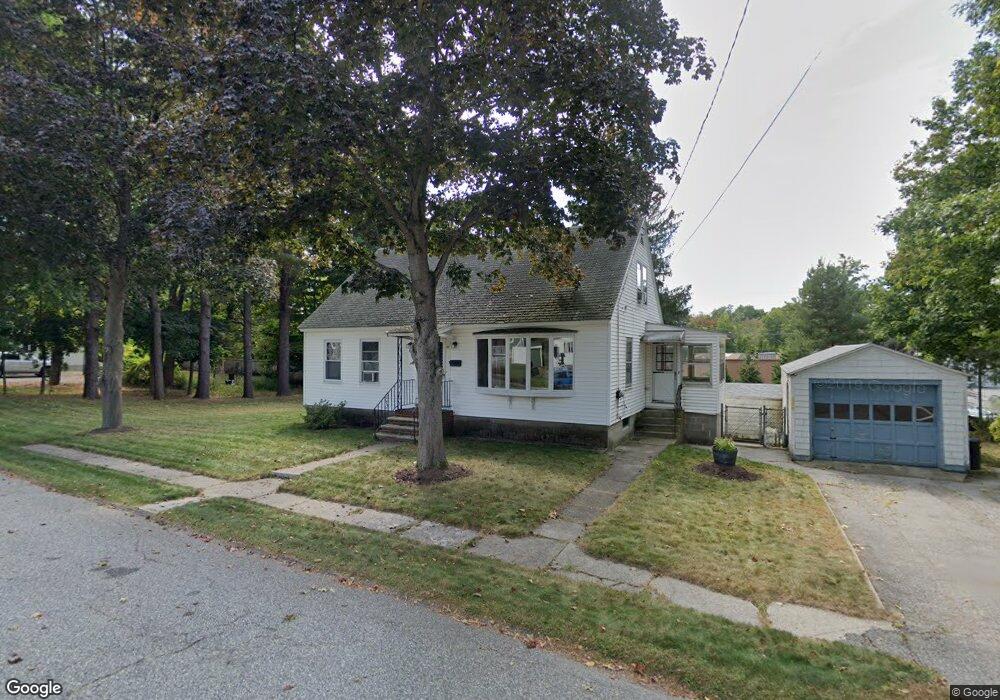
63 Thorndike Rd North Andover, MA 01845
Estimated Value: $602,479 - $667,000
3
Beds
2
Baths
1,404
Sq Ft
$442/Sq Ft
Est. Value
About This Home
This home is located at 63 Thorndike Rd, North Andover, MA 01845 and is currently estimated at $620,370, approximately $441 per square foot. 63 Thorndike Rd is a home located in Essex County with nearby schools including Thomson Elementary School, North Andover Middle School, and North Andover High School.
Ownership History
Date
Name
Owned For
Owner Type
Purchase Details
Closed on
Apr 30, 2013
Sold by
Kandrut Stanley J Est
Bought by
Kandrut Scott
Current Estimated Value
Home Financials for this Owner
Home Financials are based on the most recent Mortgage that was taken out on this home.
Original Mortgage
$159,600
Outstanding Balance
$113,903
Interest Rate
3.64%
Mortgage Type
New Conventional
Estimated Equity
$506,467
Purchase Details
Closed on
Dec 20, 2011
Sold by
Stanley J Kandrut Ret
Bought by
Kandrut Stanley J
Create a Home Valuation Report for This Property
The Home Valuation Report is an in-depth analysis detailing your home's value as well as a comparison with similar homes in the area
Home Values in the Area
Average Home Value in this Area
Purchase History
| Date | Buyer | Sale Price | Title Company |
|---|---|---|---|
| Kandrut Scott | $168,000 | -- | |
| Kandrut Stanley J | -- | -- |
Source: Public Records
Mortgage History
| Date | Status | Borrower | Loan Amount |
|---|---|---|---|
| Open | Kandrut Scott | $159,600 |
Source: Public Records
Tax History Compared to Growth
Tax History
| Year | Tax Paid | Tax Assessment Tax Assessment Total Assessment is a certain percentage of the fair market value that is determined by local assessors to be the total taxable value of land and additions on the property. | Land | Improvement |
|---|---|---|---|---|
| 2025 | $5,810 | $516,000 | $307,600 | $208,400 |
| 2024 | $5,596 | $504,600 | $289,500 | $215,100 |
| 2023 | $5,492 | $448,700 | $266,000 | $182,700 |
| 2022 | $5,420 | $400,600 | $238,900 | $161,700 |
| 2021 | $5,369 | $378,900 | $217,200 | $161,700 |
| 2020 | $5,117 | $372,400 | $217,200 | $155,200 |
| 2019 | $4,994 | $372,400 | $217,200 | $155,200 |
| 2018 | $5,411 | $372,400 | $217,200 | $155,200 |
| 2017 | $3,360 | $235,300 | $168,900 | $66,400 |
| 2016 | $3,358 | $235,300 | $168,900 | $66,400 |
| 2015 | $3,386 | $235,300 | $168,900 | $66,400 |
Source: Public Records
Map
Nearby Homes
- 62 Brightwood Ave
- 148 Main St Unit A508
- 148 Main St Unit C538
- 148 Main St Unit A307
- 29 Brightwood Ave
- 385 Sutton St
- 64 2nd St
- 12 Walker Rd Unit 6
- 68 Belmont St Unit 68
- 826 Osgood St
- 68 Union St
- 127 Marblehead St Unit A
- 75 Beverly St Unit 75
- 11 W Bradstreet Rd
- 33 Herrick Rd
- 8 Little Rd
- 317 Middlesex St
- 13 Woodland St
- 52 Howard St
- 7 Stevens Ct
- 66 Thorndike Rd
- 51 Thorndike Rd
- 53 Thorndike Rd Unit 2
- 53 Thorndike Rd
- 54 Perley Rd
- 56 Thorndike Rd
- 41 Perley Rd
- 46 Thorndike Rd
- 40 Perley Rd
- 41 Thorndike Rd
- 41 Thorndike Rd Unit 3
- 41 Thorndike Rd Unit 2
- 21 Irving Rd
- 33 Perley Rd
- 28 Irving Rd
- 32 Thorndike Rd
- 33 Thorndike Rd
- 22 Irving Rd
- 35 Thorndike Rd Unit 1
- 51 Columbia Rd