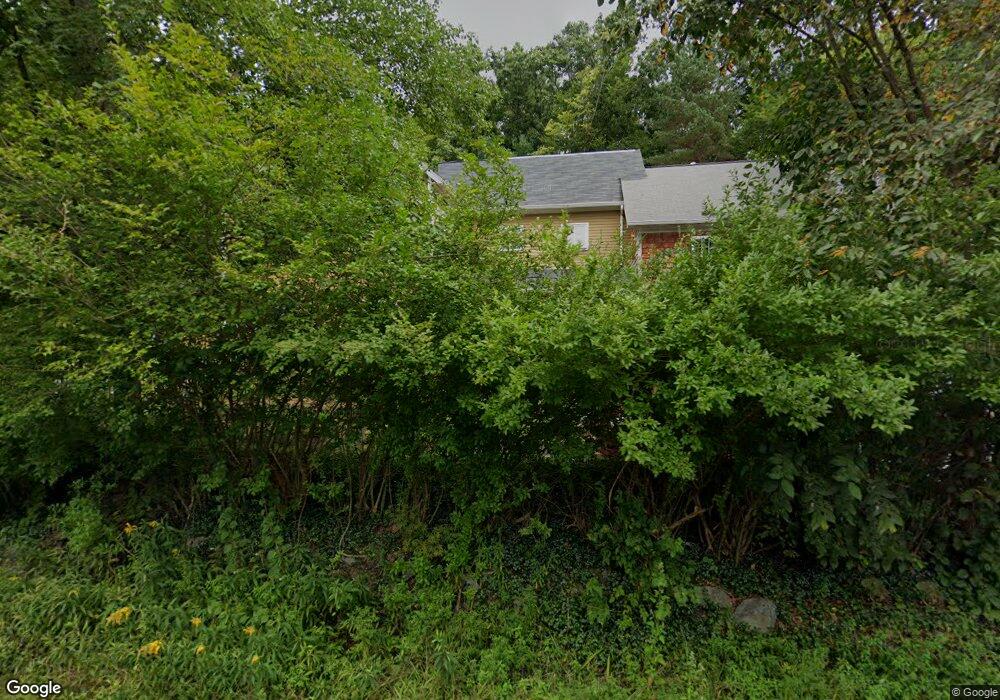
63 Thurlow St Georgetown, MA 01833
Estimated Value: $830,062 - $1,050,000
3
Beds
1
Bath
2,976
Sq Ft
$320/Sq Ft
Est. Value
About This Home
This home is located at 63 Thurlow St, Georgetown, MA 01833 and is currently estimated at $951,766, approximately $319 per square foot. 63 Thurlow St is a home located in Essex County with nearby schools including Perley Elementary School, Penn Brook School, and Georgetown High School.
Ownership History
Date
Name
Owned For
Owner Type
Purchase Details
Closed on
Aug 19, 2003
Sold by
Alberts Bert H and Sweeney Darcy
Bought by
Yeaton John H and Yeaton Yoko
Current Estimated Value
Purchase Details
Closed on
Feb 13, 1987
Sold by
Spencer Richard F
Bought by
Alberts Bert H
Create a Home Valuation Report for This Property
The Home Valuation Report is an in-depth analysis detailing your home's value as well as a comparison with similar homes in the area
Home Values in the Area
Average Home Value in this Area
Purchase History
| Date | Buyer | Sale Price | Title Company |
|---|---|---|---|
| Yeaton John H | $330,000 | -- | |
| Alberts Bert H | $154,900 | -- |
Source: Public Records
Mortgage History
| Date | Status | Borrower | Loan Amount |
|---|---|---|---|
| Open | Alberts Bert H | $60,000 | |
| Open | Alberts Bert H | $350,400 | |
| Closed | Alberts Bert H | $314,400 |
Source: Public Records
Tax History
| Year | Tax Paid | Tax Assessment Tax Assessment Total Assessment is a certain percentage of the fair market value that is determined by local assessors to be the total taxable value of land and additions on the property. | Land | Improvement |
|---|---|---|---|---|
| 2025 | $8,777 | $793,600 | $309,000 | $484,600 |
| 2024 | $8,181 | $651,900 | $213,500 | $438,400 |
| 2023 | $8,392 | $646,500 | $213,500 | $433,000 |
| 2022 | $8,193 | $581,900 | $185,800 | $396,100 |
| 2021 | $8,155 | $513,200 | $185,800 | $327,400 |
| 2020 | $8,170 | $513,200 | $185,800 | $327,400 |
| 2019 | $8,041 | $509,600 | $182,200 | $327,400 |
| 2018 | $8,092 | $509,600 | $182,200 | $327,400 |
| 2017 | $7,508 | $463,200 | $182,200 | $281,000 |
| 2016 | $7,270 | $458,100 | $182,200 | $275,900 |
| 2015 | $6,473 | $403,800 | $182,200 | $221,600 |
| 2014 | $5,467 | $389,100 | $182,200 | $206,900 |
Source: Public Records
Map
Nearby Homes
Your Personal Tour Guide
Ask me questions while you tour the home.