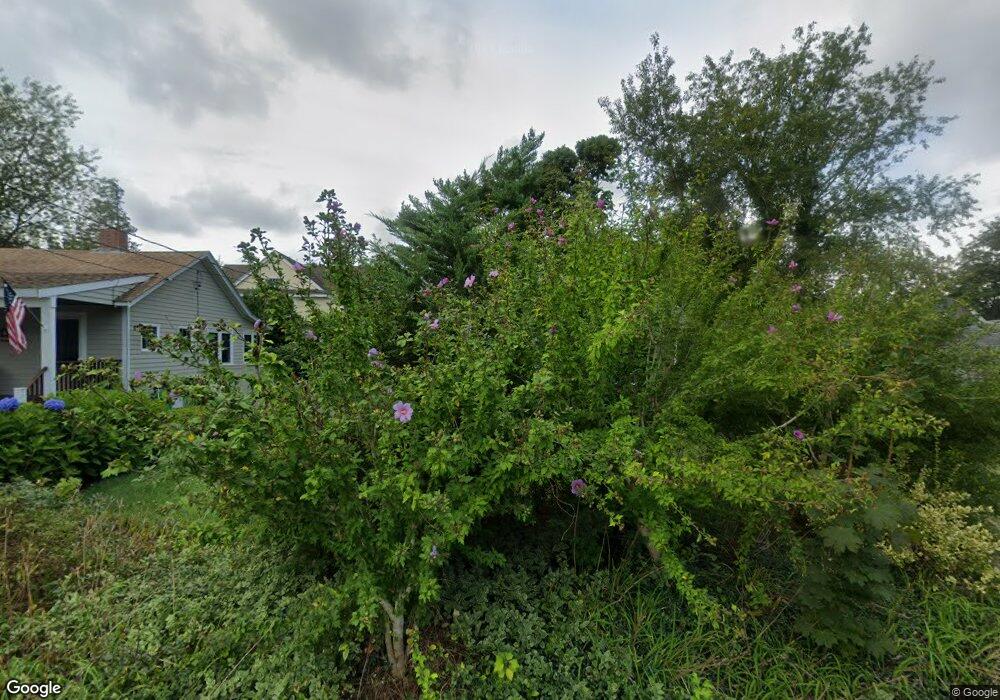
63 Wamsutta Ave Pocasset, MA 02559
Pocasset NeighborhoodEstimated Value: $578,000 - $693,000
2
Beds
1
Bath
777
Sq Ft
$832/Sq Ft
Est. Value
About This Home
This home is located at 63 Wamsutta Ave, Pocasset, MA 02559 and is currently estimated at $646,777, approximately $832 per square foot. 63 Wamsutta Ave is a home located in Barnstable County with nearby schools including Bourne High School and Cadence Academy Preschool - Bourne.
Ownership History
Date
Name
Owned For
Owner Type
Purchase Details
Closed on
Apr 25, 2019
Sold by
Brooks Jean A and Brooks John E
Bought by
Brooks John E
Current Estimated Value
Purchase Details
Closed on
Oct 25, 1999
Sold by
Ryder Robert B
Bought by
Brooks Philip J
Home Financials for this Owner
Home Financials are based on the most recent Mortgage that was taken out on this home.
Original Mortgage
$75,700
Interest Rate
7.83%
Mortgage Type
Purchase Money Mortgage
Purchase Details
Closed on
Aug 8, 1995
Sold by
Townsend Ann Ryder
Bought by
Ryder Robert Benjamin
Create a Home Valuation Report for This Property
The Home Valuation Report is an in-depth analysis detailing your home's value as well as a comparison with similar homes in the area
Home Values in the Area
Average Home Value in this Area
Purchase History
| Date | Buyer | Sale Price | Title Company |
|---|---|---|---|
| Brooks John E | -- | -- | |
| Brooks John E | -- | -- | |
| Brooks Philip J | $85,600 | -- | |
| Brooks Philip J | $85,600 | -- | |
| Ryder Robert Benjamin | $55,900 | -- | |
| Ryder Robert Benjamin | $55,900 | -- |
Source: Public Records
Mortgage History
| Date | Status | Borrower | Loan Amount |
|---|---|---|---|
| Previous Owner | Ryder Robert Benjamin | $75,700 |
Source: Public Records
Tax History Compared to Growth
Tax History
| Year | Tax Paid | Tax Assessment Tax Assessment Total Assessment is a certain percentage of the fair market value that is determined by local assessors to be the total taxable value of land and additions on the property. | Land | Improvement |
|---|---|---|---|---|
| 2025 | $4,355 | $557,600 | $373,000 | $184,600 |
| 2024 | $4,258 | $530,900 | $355,200 | $175,700 |
| 2023 | $4,146 | $470,600 | $314,400 | $156,200 |
| 2022 | $3,751 | $371,800 | $246,600 | $125,200 |
| 2021 | $3,652 | $339,100 | $224,400 | $114,700 |
| 2020 | $3,557 | $331,200 | $222,300 | $108,900 |
| 2019 | $3,422 | $325,600 | $222,300 | $103,300 |
| 2018 | $3,283 | $311,500 | $217,200 | $94,300 |
| 2017 | $3,177 | $308,400 | $215,100 | $93,300 |
| 2016 | $2,941 | $289,500 | $204,400 | $85,100 |
| 2015 | $2,752 | $273,300 | $188,200 | $85,100 |
Source: Public Records
Map
Nearby Homes
- 171 Bellavista Dr
- 22 Nairn Rd
- 34 Kenwood Rd
- 45 Kenwood Rd
- 254 Barlows Landing Rd
- 48 Red Brook Harbor Rd
- 70 Wings Neck Rd
- 3 Red Brook Pond Dr
- 24 Richmond Rd
- 940 County Rd
- 1094 County Rd
- 940 County Rd
- 709 County Rd
- 14 Navajo Rd
- 174 Barlows Landing Rd
- 7 4th Ave
- 15 1st St
- 89 Harbor Dr
- 39 Bennets Neck Dr
- 75 Winsor Rd