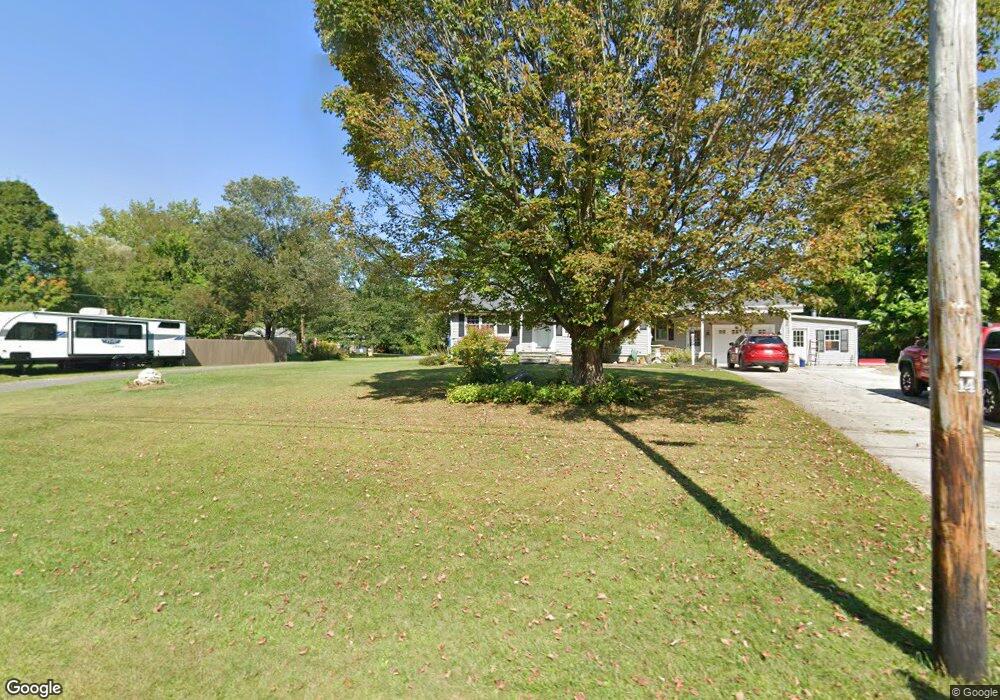
63 Wells Rd Cheshire, MA 01225
Estimated Value: $279,000 - $328,000
3
Beds
1
Bath
1,496
Sq Ft
$200/Sq Ft
Est. Value
About This Home
This home is located at 63 Wells Rd, Cheshire, MA 01225 and is currently estimated at $298,807, approximately $199 per square foot. 63 Wells Rd is a home located in Berkshire County with nearby schools including Hoosac Valley Middle & High School.
Ownership History
Date
Name
Owned For
Owner Type
Purchase Details
Closed on
Feb 20, 2002
Sold by
Lancia Ronald V and Lancia Lois M
Bought by
Lancia Bren and Lancia Alimah M
Current Estimated Value
Home Financials for this Owner
Home Financials are based on the most recent Mortgage that was taken out on this home.
Original Mortgage
$68,000
Interest Rate
7.08%
Mortgage Type
Purchase Money Mortgage
Create a Home Valuation Report for This Property
The Home Valuation Report is an in-depth analysis detailing your home's value as well as a comparison with similar homes in the area
Home Values in the Area
Average Home Value in this Area
Purchase History
| Date | Buyer | Sale Price | Title Company |
|---|---|---|---|
| Lancia Bren | $80,000 | -- | |
| Lancia Bren V | $80,000 | -- |
Source: Public Records
Mortgage History
| Date | Status | Borrower | Loan Amount |
|---|---|---|---|
| Open | Lancia Bren V | $80,000 | |
| Closed | Lancia Bren V | $68,000 | |
| Previous Owner | Lancia Bren V | $20,000 |
Source: Public Records
Tax History Compared to Growth
Tax History
| Year | Tax Paid | Tax Assessment Tax Assessment Total Assessment is a certain percentage of the fair market value that is determined by local assessors to be the total taxable value of land and additions on the property. | Land | Improvement |
|---|---|---|---|---|
| 2025 | $2,800 | $251,600 | $52,800 | $198,800 |
| 2024 | $2,876 | $248,600 | $50,500 | $198,100 |
| 2023 | $2,759 | $230,500 | $53,600 | $176,900 |
| 2022 | $2,524 | $197,800 | $56,300 | $141,500 |
| 2021 | $2,528 | $189,100 | $53,600 | $135,500 |
| 2020 | $2,411 | $179,400 | $53,600 | $125,800 |
| 2019 | $2,409 | $183,900 | $59,400 | $124,500 |
| 2018 | $1,091 | $177,900 | $59,400 | $118,500 |
| 2017 | $2,204 | $177,900 | $59,400 | $118,500 |
| 2016 | $2,181 | $177,900 | $59,400 | $118,500 |
| 2015 | $2,075 | $173,800 | $53,200 | $120,600 |
Source: Public Records
Map
Nearby Homes
- 16 2nd Ave
- 29 4th Ave
- 136 Church St Unit 142
- 108 Church St
- 53 Depot St
- 57 Church St
- 18 W Mountain Rd
- 12 South St
- 573 Stafford Hill Rd
- 40 Curran Rd
- 83 Devonshire Dr
- 20 Pleasant View Dr
- 136 Ingalls Rd
- 52 Alger St
- 21 Overlook Terrace
- 9 Pinnacle Point
- 135 Commercial St
- Lot 9E Stewart White Rd
- Lot 10E Stewart White Rd
- 219 West Rd