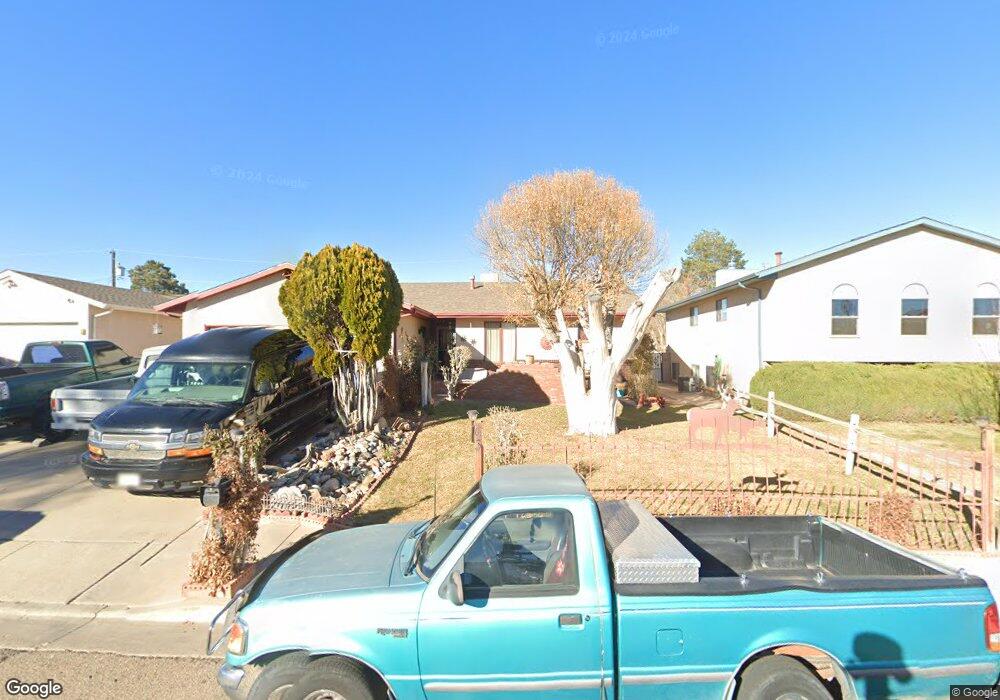
63 Wheatridge Dr Pueblo, CO 81005
Beulah Heights NeighborhoodEstimated Value: $273,000 - $332,000
3
Beds
2
Baths
1,276
Sq Ft
$234/Sq Ft
Est. Value
About This Home
This home is located at 63 Wheatridge Dr, Pueblo, CO 81005 and is currently estimated at $298,611, approximately $234 per square foot. 63 Wheatridge Dr is a home located in Pueblo County with nearby schools including Beulah Heights Elementary School, Roncalli STEM Academy, and South High School.
Ownership History
Date
Name
Owned For
Owner Type
Purchase Details
Closed on
Mar 27, 1992
Sold by
Minnequa Works Fed Cr Union
Bought by
Lopez Ismael M + Margaret M
Current Estimated Value
Purchase Details
Closed on
Aug 2, 1991
Sold by
Sisnroy Niki J
Bought by
Minnequa Works Fed Cr Union
Purchase Details
Closed on
Sep 6, 1989
Sold by
Sisnroy Sharon E + Niki
Bought by
Sisnroy Niki J
Purchase Details
Closed on
Jul 11, 1989
Sold by
Sisnroy Larry L + Sharon E
Bought by
Sisnroy Sharon E + Niki
Purchase Details
Closed on
Apr 29, 1988
Sold by
Sisnroy Larry L
Bought by
Sisnroy Larry L + Sharon E
Purchase Details
Closed on
Aug 21, 1979
Sold by
Sisnroy Larry L + Niki J
Bought by
Sisnroy Larry L
Purchase Details
Closed on
Apr 27, 1979
Sold by
Ward C M
Bought by
Sisnroy Larry L + Niki J
Purchase Details
Closed on
Dec 22, 1978
Sold by
Terlep John J Dba Terlep Ente
Bought by
Ward C M
Purchase Details
Closed on
Jul 7, 1977
Sold by
Terlep Albert + Rose
Bought by
Terlep John J Dba Terlep Ente
Create a Home Valuation Report for This Property
The Home Valuation Report is an in-depth analysis detailing your home's value as well as a comparison with similar homes in the area
Home Values in the Area
Average Home Value in this Area
Purchase History
| Date | Buyer | Sale Price | Title Company |
|---|---|---|---|
| Lopez Ismael M + Margaret M | $53,500 | -- | |
| Minnequa Works Fed Cr Union | -- | -- | |
| Sisnroy Niki J | -- | -- | |
| Sisnroy Sharon E + Niki | -- | -- | |
| Sisnroy Larry L + Sharon E | -- | -- | |
| Sisnroy Larry L | -- | -- | |
| Sisnroy Larry L + Niki J | $53,300 | -- | |
| Ward C M | -- | -- | |
| Terlep John J Dba Terlep Ente | -- | -- |
Source: Public Records
Tax History Compared to Growth
Tax History
| Year | Tax Paid | Tax Assessment Tax Assessment Total Assessment is a certain percentage of the fair market value that is determined by local assessors to be the total taxable value of land and additions on the property. | Land | Improvement |
|---|---|---|---|---|
| 2024 | $911 | $15,830 | -- | -- |
| 2023 | $922 | $19,520 | $1,340 | $18,180 |
| 2022 | $724 | $14,110 | $1,390 | $12,720 |
| 2021 | $747 | $14,520 | $1,430 | $13,090 |
| 2020 | $601 | $14,520 | $1,430 | $13,090 |
| 2019 | $602 | $11,702 | $930 | $10,772 |
| 2018 | $496 | $10,718 | $936 | $9,782 |
| 2017 | $500 | $10,718 | $936 | $9,782 |
| 2016 | $492 | $10,685 | $1,035 | $9,650 |
| 2015 | $245 | $10,685 | $1,035 | $9,650 |
| 2014 | $438 | $9,532 | $1,035 | $8,497 |
Source: Public Records
Map
Nearby Homes
- 75 Wheatridge Dr
- 2221 S Prairie Ave Unit 106
- 2221 S Prairie Ave Unit 150
- 2221 S Prairie Ave Unit 36
- 2221 S Prairie Ave Unit 59
- 2127 S Prairie Ave
- 3061 Oneal Ave
- 3361 Oneal Ave
- 2531 Delphinium St
- 2521 Emilia St
- 2019 Emilia St
- 2622 Holmes St
- 2416 Winnipeg St
- 2021 Lynwood Ln
- 1824 Moore Ave
- 2101 Acero Ave
- TBD 6 Ivywood Ln
- TBD 8 Ivywood Ln
- TBD 7 Ivywood Ln
- 2029 Hollywood Dr
- 65 Wheatridge Dr
- 61 Wheatridge Dr
- 67 Wheatridge Dr
- 59 Wheatridge Dr
- 60 Wheatridge Dr
- 62 Wheatridge Dr
- 58 Wheatridge Dr
- 57 Wheatridge Dr
- 69 Wheatridge Dr
- 64 Wheatridge Dr
- 56 Wheatridge Dr
- 0 Wheatridge Dr
- 66 Wheatridge Dr
- 54 Wheatridge Dr
- 71 Wheatridge Dr
- 55 Wheatridge Dr
- 24 Wheatridge Dr
- 22 Wheatridge Dr
- 26 Wheatridge Dr
- 20 Wheatridge Dr