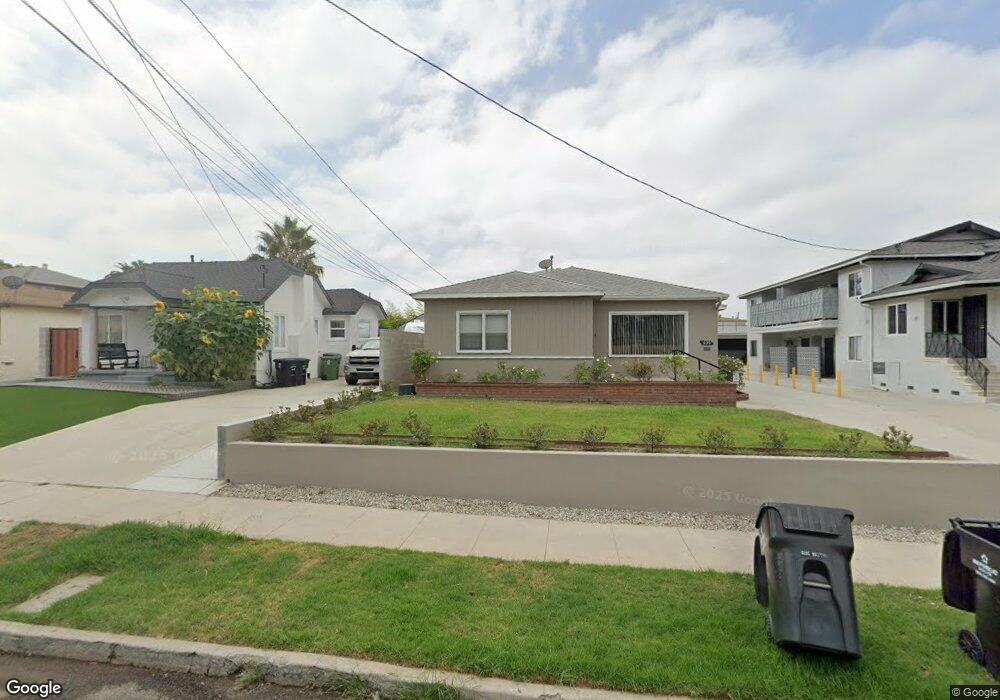
630 E Queen St Unit 13 Inglewood, CA 90301
Estimated Value: $506,000 - $560,000
2
Beds
2
Baths
1,171
Sq Ft
$461/Sq Ft
Est. Value
About This Home
This home is located at 630 E Queen St Unit 13, Inglewood, CA 90301 and is currently estimated at $540,358, approximately $461 per square foot. 630 E Queen St Unit 13 is a home located in Los Angeles County with nearby schools including Kelso (William H.) Elementary School, Crozier (George W.) Middle School, and Inglewood High School.
Ownership History
Date
Name
Owned For
Owner Type
Purchase Details
Closed on
Jul 13, 2006
Sold by
Floyd Jonathan G
Bought by
Davis Susie F
Current Estimated Value
Home Financials for this Owner
Home Financials are based on the most recent Mortgage that was taken out on this home.
Original Mortgage
$297,500
Outstanding Balance
$177,592
Interest Rate
6.75%
Mortgage Type
Balloon
Estimated Equity
$362,766
Purchase Details
Closed on
Apr 21, 1995
Sold by
Floyd Jonathan Gregory
Bought by
Floyd Jonathan G
Home Financials for this Owner
Home Financials are based on the most recent Mortgage that was taken out on this home.
Original Mortgage
$150,600
Interest Rate
8.46%
Mortgage Type
Assumption
Purchase Details
Closed on
Apr 23, 1993
Sold by
Bien Francis E and Bien Lorraine R
Bought by
Floyd Jonathan Gregory
Home Financials for this Owner
Home Financials are based on the most recent Mortgage that was taken out on this home.
Original Mortgage
$140,231
Interest Rate
7.25%
Mortgage Type
Assumption
Create a Home Valuation Report for This Property
The Home Valuation Report is an in-depth analysis detailing your home's value as well as a comparison with similar homes in the area
Purchase History
| Date | Buyer | Sale Price | Title Company |
|---|---|---|---|
| Davis Susie F | $350,000 | Oct La | |
| Floyd Jonathan G | -- | Commonwealth Land Title Co | |
| Floyd Jonathan Gregory | $135,500 | Gateway Title Company |
Source: Public Records
Mortgage History
| Date | Status | Borrower | Loan Amount |
|---|---|---|---|
| Open | Davis Susie F | $297,500 | |
| Previous Owner | Floyd Jonathan G | $150,600 | |
| Previous Owner | Floyd Jonathan Gregory | $140,231 |
Source: Public Records
Tax History
| Year | Tax Paid | Tax Assessment Tax Assessment Total Assessment is a certain percentage of the fair market value that is determined by local assessors to be the total taxable value of land and additions on the property. | Land | Improvement |
|---|---|---|---|---|
| 2025 | $5,899 | $468,910 | $318,057 | $150,853 |
| 2024 | $5,899 | $459,717 | $311,821 | $147,896 |
| 2023 | $5,837 | $450,704 | $305,707 | $144,997 |
| 2022 | $5,950 | $441,867 | $299,713 | $142,154 |
| 2021 | $5,890 | $433,204 | $293,837 | $139,367 |
| 2019 | $5,523 | $420,357 | $285,123 | $135,234 |
| 2018 | $5,060 | $376,000 | $255,000 | $121,000 |
| 2016 | $4,181 | $314,300 | $213,000 | $101,300 |
| 2015 | $2,850 | $209,800 | $142,200 | $67,600 |
| 2014 | $2,903 | $209,800 | $142,200 | $67,600 |
Source: Public Records
Map
Nearby Homes
- 612 Aerick St
- 425 E Tamarack Ave
- 434 E Spruce Ave Unit 100
- 434 E Spruce Ave Unit 106
- 811 E Nutwood St
- 756 Daniel Freeman Cir
- 222 N Locust St
- 551 Daniel Freeman Cir
- 521 S Flower St
- 320 E Spruce Ave
- 533 Daniel Freeman Cir
- 763 Sienna Way
- 3814 Dunford Ln Unit M
- 614 Myrtle Ave
- 8712 Chessington Dr Unit 255D
- 8712 Chessington Dr Unit 261F
- 8718 Weybridge Place
- 8726 Beckenham Ln Unit A
- 317 S La Brea Ave
- 212 E Tamarack Ave
- 630 E Queen St Unit 16
- 630 E Queen St Unit 6
- 630 E Queen St Unit 5
- 630 E Queen St Unit 12
- 630 E Queen St Unit 4
- 630 E Queen St
- 630 E Queen St Unit 17
- 630 E Queen St Unit 14
- 630 E Queen St Unit 11
- 630 E Queen St Unit 10
- 630 E Queen St Unit 8
- 630 E Queen St Unit 1
- 632 E Queen St
- 620 E Queen St
- 636 E Queen St
- 629 Manchester Terrace Unit 3
- 616 E Queen St
- 640 E Queen St Unit 1
- 640 E Queen St
- 635 Manchester Terrace
Your Personal Tour Guide
Ask me questions while you tour the home.