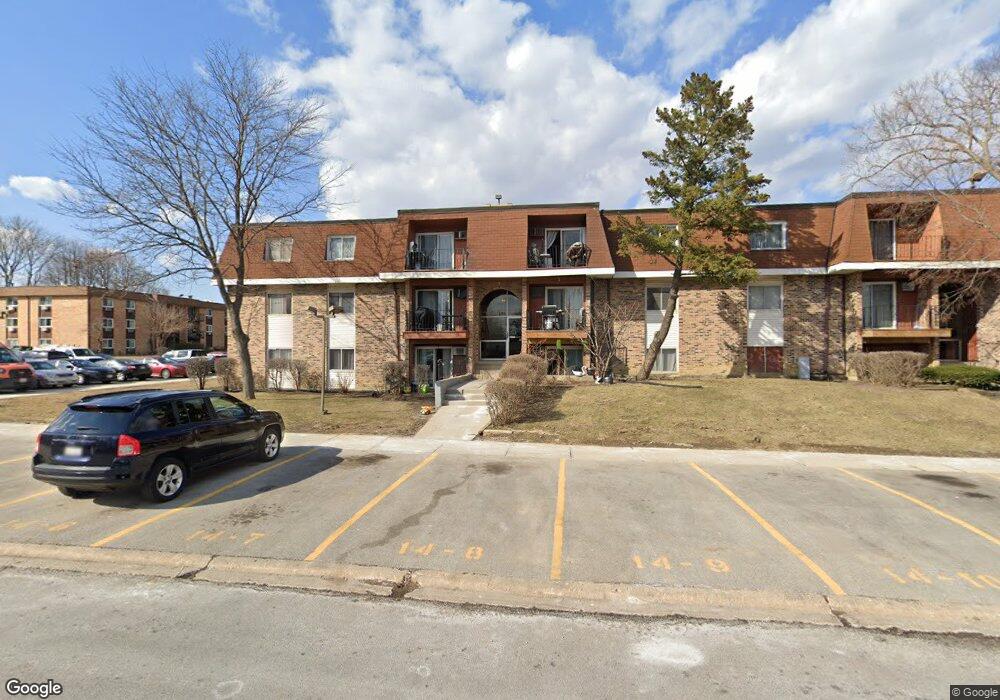
630 Mesa Dr Unit 14213 Hoffman Estates, IL 60169
South Hoffman Estates NeighborhoodEstimated Value: $137,801 - $184,000
2
Beds
--
Bath
1,000
Sq Ft
$163/Sq Ft
Est. Value
About This Home
This home is located at 630 Mesa Dr Unit 14213, Hoffman Estates, IL 60169 and is currently estimated at $162,950, approximately $162 per square foot. 630 Mesa Dr Unit 14213 is a home located in Cook County with nearby schools including Hoover Math And Science Academy, Helen Keller Junior High School, and J B Conant High School.
Ownership History
Date
Name
Owned For
Owner Type
Purchase Details
Closed on
Jul 31, 2003
Sold by
Gomez Reynaldo
Bought by
Torres Salvador
Current Estimated Value
Home Financials for this Owner
Home Financials are based on the most recent Mortgage that was taken out on this home.
Original Mortgage
$99,813
Interest Rate
6.1%
Mortgage Type
FHA
Purchase Details
Closed on
Sep 1, 2001
Sold by
Martinez Erasmo and Serna Ricardo
Bought by
Gomez Reynaldo
Home Financials for this Owner
Home Financials are based on the most recent Mortgage that was taken out on this home.
Original Mortgage
$84,390
Interest Rate
6.99%
Mortgage Type
FHA
Purchase Details
Closed on
Jun 28, 1996
Sold by
Contreras Salvador and Contreras Maria
Bought by
Martinez Erasmo and Serna Ricardo
Home Financials for this Owner
Home Financials are based on the most recent Mortgage that was taken out on this home.
Original Mortgage
$51,000
Interest Rate
8.07%
Mortgage Type
FHA
Create a Home Valuation Report for This Property
The Home Valuation Report is an in-depth analysis detailing your home's value as well as a comparison with similar homes in the area
Home Values in the Area
Average Home Value in this Area
Purchase History
| Date | Buyer | Sale Price | Title Company |
|---|---|---|---|
| Torres Salvador | $103,000 | Chicago Title Insurance Comp | |
| Gomez Reynaldo | $87,000 | -- | |
| Martinez Erasmo | $52,500 | Lawyers Title Insurance Corp |
Source: Public Records
Mortgage History
| Date | Status | Borrower | Loan Amount |
|---|---|---|---|
| Previous Owner | Torres Salvador | $99,813 | |
| Previous Owner | Gomez Reynaldo | $84,390 | |
| Previous Owner | Martinez Erasmo | $51,000 |
Source: Public Records
Tax History
| Year | Tax Paid | Tax Assessment Tax Assessment Total Assessment is a certain percentage of the fair market value that is determined by local assessors to be the total taxable value of land and additions on the property. | Land | Improvement |
|---|---|---|---|---|
| 2025 | $1,962 | $14,699 | $1,574 | $13,125 |
| 2024 | $1,962 | $9,710 | $1,349 | $8,361 |
| 2023 | $1,867 | $9,710 | $1,349 | $8,361 |
| 2022 | $1,867 | $9,710 | $1,349 | $8,361 |
| 2021 | $1,405 | $7,524 | $955 | $6,569 |
| 2020 | $1,447 | $7,524 | $955 | $6,569 |
| 2019 | $1,470 | $8,449 | $955 | $7,494 |
| 2018 | $584 | $5,227 | $786 | $4,441 |
| 2017 | $593 | $5,227 | $786 | $4,441 |
| 2016 | $813 | $5,227 | $786 | $4,441 |
| 2015 | $387 | $3,827 | $730 | $3,097 |
| 2014 | $397 | $3,827 | $730 | $3,097 |
| 2013 | $368 | $3,827 | $730 | $3,097 |
Source: Public Records
Map
Nearby Homes
- 600 Mesa Dr Unit 104
- 600 Mesa Dr Unit 103
- 1180 Meadow Ln Unit 6306
- 720 Hill Dr Unit 8303
- 555 Heritage Dr Unit 315
- 1025 Higgins Quarters Dr Unit 4-109
- 730 Hill Dr Unit 9205
- 860 Olive St
- 630 Bode Rd
- 368 Willow Tree Ct
- 1063 Stonehedge Dr
- 670 Lakeview Ln
- 755 Cambridge Ln
- 625 Morton St
- 590 Durham Ct
- 712 Scarbrough Cir Unit 126
- 1570 Jefferson Rd
- 345 Maricopa Ln
- 480 Illinois Blvd
- 100 Des Plaines Ln
- 600 Mesa Dr Unit 204
- 630 Mesa Dr Unit 14116
- 630 Mesa Dr Unit 14313
- 610 Mesa Dr Unit 14305
- 610 Mesa Dr Unit 14206
- 610 Mesa Dr Unit 14105
- 600 Mesa Dr Unit 14201
- 630 Mesa Dr Unit 14215
- 600 Mesa Dr Unit 14203
- 610 Mesa Dr Unit 14308
- 600 Mesa Dr Unit 14104
- 630 Mesa Dr Unit 14113
- 630 Mesa Dr Unit 14214
- 630 Mesa Dr Unit 14315
- 600 Mesa Dr Unit 14103
- 620 Mesa Dr Unit 14309
- 600 Mesa Dr Unit 14302
- 620 Mesa Dr Unit 14212
- 600 Mesa Dr Unit 14101
- 610 Mesa Dr Unit 14107
Your Personal Tour Guide
Ask me questions while you tour the home.