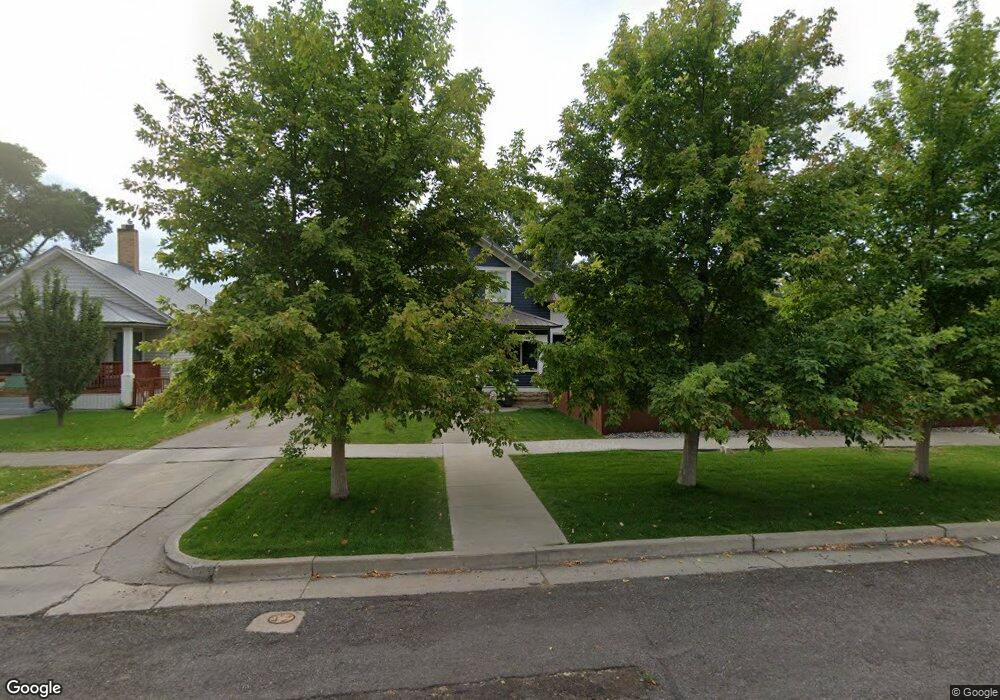
630 N 3rd St Montrose, CO 81401
Estimated Value: $568,348 - $667,000
4
Beds
3
Baths
2,741
Sq Ft
$221/Sq Ft
Est. Value
About This Home
This home is located at 630 N 3rd St, Montrose, CO 81401 and is currently estimated at $606,337, approximately $221 per square foot. 630 N 3rd St is a home located in Montrose County with nearby schools including Northside Elementary School, Centennial Middle School, and Montrose High School.
Ownership History
Date
Name
Owned For
Owner Type
Purchase Details
Closed on
Dec 30, 2016
Sold by
Keltz Brandon E and Keltz Michelle E
Bought by
Recalde Sebastian R and Recalde Joelle J
Current Estimated Value
Home Financials for this Owner
Home Financials are based on the most recent Mortgage that was taken out on this home.
Original Mortgage
$240,000
Outstanding Balance
$196,758
Interest Rate
3.94%
Mortgage Type
New Conventional
Estimated Equity
$409,579
Purchase Details
Closed on
May 6, 2002
Sold by
Keltz Beatrice J Trust
Bought by
Keltz Brandon E and Keltz Michelle E
Purchase Details
Closed on
Mar 18, 2002
Sold by
Keltz Brandon E
Bought by
Keltz Brandon E and Keltz Michelle E
Purchase Details
Closed on
Apr 23, 1999
Sold by
Keltz Beatrice J
Bought by
Keltz Beatrice J Trust
Purchase Details
Closed on
Mar 14, 1959
Sold by
Keltz Beatrice J and Braund Edra L
Bought by
Keltz Hall H and Keltz Beatrice J
Create a Home Valuation Report for This Property
The Home Valuation Report is an in-depth analysis detailing your home's value as well as a comparison with similar homes in the area
Home Values in the Area
Average Home Value in this Area
Purchase History
| Date | Buyer | Sale Price | Title Company |
|---|---|---|---|
| Recalde Sebastian R | $300,000 | Fidelity National Title | |
| Keltz Brandon E | $83,700 | -- | |
| Keltz Brandon E | -- | -- | |
| Keltz Beatrice J Trust | -- | -- | |
| Keltz Hall H | $5,700 | -- |
Source: Public Records
Mortgage History
| Date | Status | Borrower | Loan Amount |
|---|---|---|---|
| Open | Recalde Sebastian R | $240,000 |
Source: Public Records
Tax History Compared to Growth
Tax History
| Year | Tax Paid | Tax Assessment Tax Assessment Total Assessment is a certain percentage of the fair market value that is determined by local assessors to be the total taxable value of land and additions on the property. | Land | Improvement |
|---|---|---|---|---|
| 2024 | $2,705 | $37,990 | $4,200 | $33,790 |
| 2023 | $2,705 | $43,230 | $4,780 | $38,450 |
| 2022 | $1,977 | $28,730 | $3,480 | $25,250 |
| 2021 | $2,038 | $29,560 | $3,580 | $25,980 |
| 2020 | $1,673 | $24,930 | $3,090 | $21,840 |
| 2019 | $1,684 | $24,930 | $3,090 | $21,840 |
| 2018 | $1,473 | $21,280 | $2,490 | $18,790 |
| 2017 | $1,461 | $21,280 | $2,490 | $18,790 |
| 2016 | $1,509 | $22,350 | $2,510 | $19,840 |
| 2015 | $1,482 | $22,350 | $2,510 | $19,840 |
| 2014 | $1,378 | $22,230 | $2,510 | $19,720 |
Source: Public Records
Map
Nearby Homes
- 701 N 4th St
- 512 N 5th St
- 825 S 1st St
- 1037 N 1st St
- 147 E Main St Unit 147 Main , 18 N Se
- 638 N Cascade Ave
- TBD S 4th St
- 700 N Nevada Ave
- 210 N Stough Ave
- 218 N Stough Ave
- 806 N Park Ave
- 338 N Stough Ave
- 612 & 616 S 6th
- TBD N Cedar
- 1201 N San Juan Ave
- 23 S 5th St
- 814 S 7th St
- 945 N Selig Ave
- 841 N Grand Ave
- 505 Miami Rd