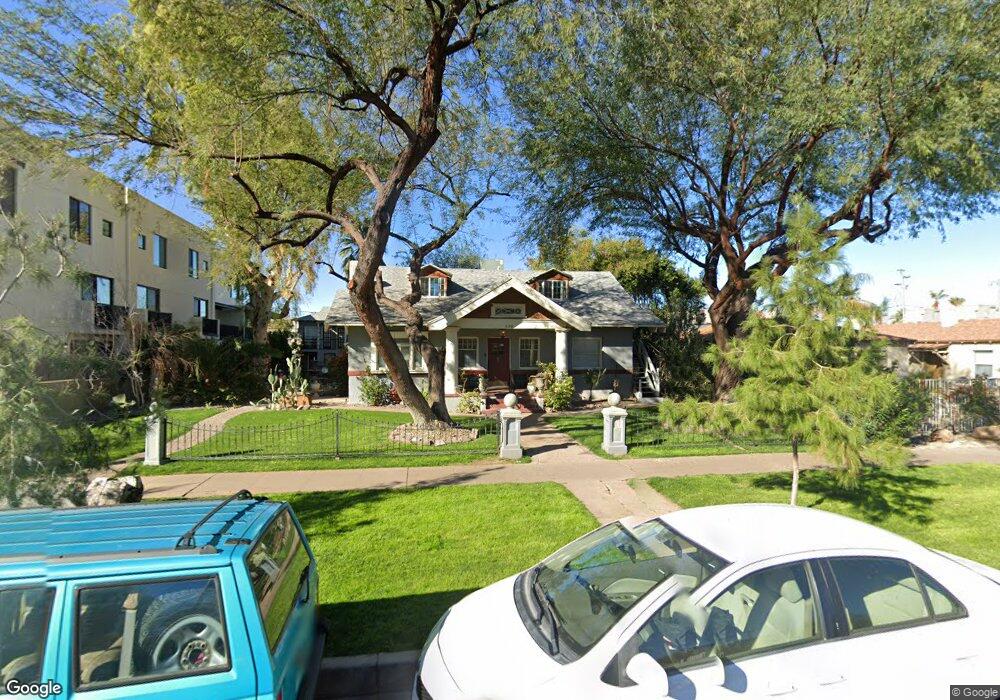
630 N 4th Ave Unit 7 Phoenix, AZ 85003
Downtown Phoenix NeighborhoodEstimated Value: $851,311 - $1,349,000
--
Bed
--
Bath
2,837
Sq Ft
$371/Sq Ft
Est. Value
About This Home
This home is located at 630 N 4th Ave Unit 7, Phoenix, AZ 85003 and is currently estimated at $1,052,328, approximately $370 per square foot. 630 N 4th Ave Unit 7 is a home located in Maricopa County with nearby schools including Kenilworth Elementary School, Phoenix Coding Academy, and Central High School.
Ownership History
Date
Name
Owned For
Owner Type
Purchase Details
Closed on
Apr 14, 2005
Sold by
Airhart Joseph A
Bought by
Laosaengthong Nui James
Current Estimated Value
Home Financials for this Owner
Home Financials are based on the most recent Mortgage that was taken out on this home.
Original Mortgage
$554,200
Outstanding Balance
$294,667
Interest Rate
6.25%
Mortgage Type
Purchase Money Mortgage
Estimated Equity
$757,661
Purchase Details
Closed on
Jun 19, 2001
Sold by
Paymard Hossein
Bought by
Guertin Kevin B
Home Financials for this Owner
Home Financials are based on the most recent Mortgage that was taken out on this home.
Original Mortgage
$226,796
Interest Rate
7.24%
Mortgage Type
Commercial
Purchase Details
Closed on
Oct 30, 2000
Sold by
Rainey William Scott
Bought by
Paymard Hossein
Home Financials for this Owner
Home Financials are based on the most recent Mortgage that was taken out on this home.
Original Mortgage
$146,250
Interest Rate
7.9%
Mortgage Type
Commercial
Create a Home Valuation Report for This Property
The Home Valuation Report is an in-depth analysis detailing your home's value as well as a comparison with similar homes in the area
Home Values in the Area
Average Home Value in this Area
Purchase History
| Date | Buyer | Sale Price | Title Company |
|---|---|---|---|
| Laosaengthong Nui James | $692,750 | Fidelity National Title | |
| Guertin Kevin B | $230,000 | Capital Title Agency | |
| Paymard Hossein | $195,000 | Capital Title Agency |
Source: Public Records
Mortgage History
| Date | Status | Borrower | Loan Amount |
|---|---|---|---|
| Open | Laosaengthong Nui James | $554,200 | |
| Previous Owner | Guertin Kevin B | $226,796 | |
| Previous Owner | Paymard Hossein | $146,250 | |
| Closed | Paymard Hossein | $28,350 | |
| Closed | Laosaengthong Nui James | $69,250 |
Source: Public Records
Tax History Compared to Growth
Tax History
| Year | Tax Paid | Tax Assessment Tax Assessment Total Assessment is a certain percentage of the fair market value that is determined by local assessors to be the total taxable value of land and additions on the property. | Land | Improvement |
|---|---|---|---|---|
| 2025 | $1,414 | $10,408 | -- | -- |
| 2024 | $1,423 | $10,072 | -- | -- |
| 2023 | $1,423 | $63,705 | $9,101 | $54,604 |
| 2022 | $1,378 | $43,862 | $6,266 | $37,596 |
| 2021 | $1,389 | $37,144 | $5,306 | $31,838 |
| 2020 | $1,406 | $34,611 | $4,937 | $29,674 |
| 2019 | $1,404 | $29,792 | $4,250 | $25,542 |
| 2018 | $1,380 | $23,153 | $3,300 | $19,853 |
| 2017 | $1,346 | $20,843 | $2,970 | $17,873 |
| 2016 | $1,307 | $18,506 | $2,640 | $15,866 |
| 2015 | $1,226 | $11,390 | $1,621 | $9,769 |
Source: Public Records
Map
Nearby Homes
- 620 N 4th Ave Unit 10
- 805 N 4th Ave Unit 902
- 805 N 4th Ave Unit 208
- 805 N 4th Ave Unit 507
- 805 N 4th Ave Unit 101
- 833 N 2nd Ave
- 387 N 2nd Ave Unit F2
- 825 N 2nd Ave
- 235 W Portland St
- 525 W Portland St
- 850 N 8th Ave Unit 9
- 850 N 8th Ave Unit 10
- 850 N 8th Ave Unit 7
- 777 W Roosevelt St Unit 2
- 820 N 8th Ave Unit 22
- 208 W Portland St Unit 460
- 100 W Portland St Unit 404
- 100 W Portland St Unit 401
- 200 W Portland St Unit 827
- 200 W Portland St Unit 1312
- 630 N 4th Ave
- 636 N 4th Ave Unit 4
- 636 N 4th Ave Unit 5
- 636 N 4th Ave
- 636 N 4th Ave Unit 2
- 636 N 4th Ave Unit 7
- 636 N 4th Ave Unit 9
- 636 N 4th Ave Unit 6
- 636 N 4th Ave Unit 3
- 636 N 4th Ave Unit 10
- 636 N 4th Ave Unit 8
- 636 N 4th Ave Unit 1
- 620 N 4th Ave Unit 12
- 620 N 4th Ave Unit 11
- 620 N 4th Ave Unit 9
- 620 N 4th Ave Unit 8
- 620 N 4th Ave Unit 7
- 620 N 4th Ave Unit 6
- 620 N 4th Ave Unit 5
- 620 N 4th Ave Unit 4