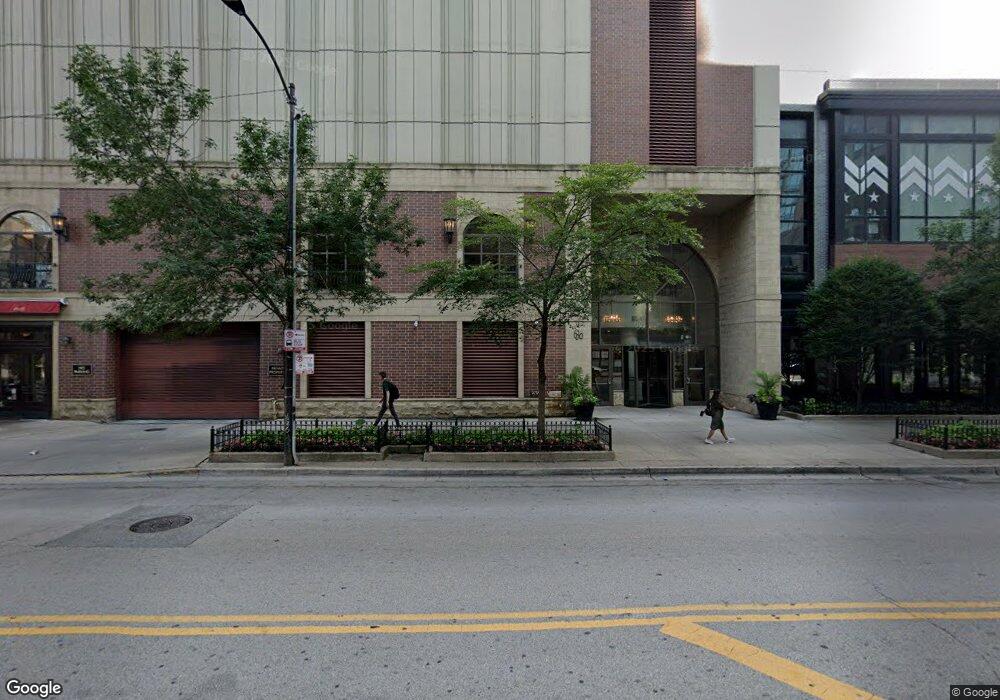
630 N State St, Unit 1204 Chicago, IL 60654
River North NeighborhoodEstimated Value: $212,000 - $285,000
Studio
--
Bath
--
Sq Ft
14,593
Sq Ft Lot
About This Home
This home is located at 630 N State St Unit 1204, Chicago, IL 60654 and is currently estimated at $246,134. 630 N State St Unit 1204 is a home located in Cook County with nearby schools including Ogden Elementary School, Wells Community Academy High School, and Muchin College Prep.
Ownership History
Date
Name
Owned For
Owner Type
Purchase Details
Closed on
May 15, 2006
Sold by
Rios Ernestina
Bought by
Ferrice Fernali
Current Estimated Value
Home Financials for this Owner
Home Financials are based on the most recent Mortgage that was taken out on this home.
Original Mortgage
$140,000
Outstanding Balance
$80,945
Interest Rate
6.66%
Mortgage Type
Fannie Mae Freddie Mac
Estimated Equity
$165,189
Purchase Details
Closed on
May 10, 2006
Sold by
Ferrice Fernali
Bought by
Mitchell Jeffrey B and Mitchell Jerome A
Home Financials for this Owner
Home Financials are based on the most recent Mortgage that was taken out on this home.
Original Mortgage
$140,000
Outstanding Balance
$80,945
Interest Rate
6.66%
Mortgage Type
Fannie Mae Freddie Mac
Estimated Equity
$165,189
Purchase Details
Closed on
Oct 30, 2003
Sold by
Triad Investors Llc
Bought by
630 North State Parkway Llc
Purchase Details
Closed on
Dec 1, 2000
Sold by
630 North State Parkway Llc
Bought by
Ferrice Fernali
Home Financials for this Owner
Home Financials are based on the most recent Mortgage that was taken out on this home.
Original Mortgage
$135,000
Interest Rate
7.86%
Create a Home Valuation Report for This Property
The Home Valuation Report is an in-depth analysis detailing your home's value as well as a comparison with similar homes in the area
Home Values in the Area
Average Home Value in this Area
Purchase History
| Date | Buyer | Sale Price | Title Company |
|---|---|---|---|
| Ferrice Fernali | -- | Pntn | |
| Mitchell Jeffrey B | $190,000 | Pntn | |
| 630 North State Parkway Llc | -- | Nnnt | |
| Ferrice Fernali | $148,000 | -- |
Source: Public Records
Mortgage History
| Date | Status | Borrower | Loan Amount |
|---|---|---|---|
| Open | Mitchell Jeffrey B | $140,000 | |
| Previous Owner | Ferrice Fernali | $135,000 |
Source: Public Records
Tax History
| Year | Tax Paid | Tax Assessment Tax Assessment Total Assessment is a certain percentage of the fair market value that is determined by local assessors to be the total taxable value of land and additions on the property. | Land | Improvement |
|---|---|---|---|---|
| 2025 | $4,203 | $19,100 | $952 | $18,148 |
| 2024 | $4,203 | $19,100 | $952 | $18,148 |
| 2023 | $4,097 | $19,920 | $767 | $19,153 |
| 2022 | $4,097 | $19,920 | $767 | $19,153 |
| 2021 | $4,097 | $20,373 | $767 | $19,606 |
| 2020 | $4,082 | $18,323 | $592 | $17,731 |
| 2019 | $3,997 | $19,893 | $592 | $19,301 |
| 2018 | $3,930 | $19,893 | $592 | $19,301 |
| 2017 | $3,644 | $16,929 | $504 | $16,425 |
| 2016 | $2,891 | $16,929 | $504 | $16,425 |
| 2015 | $2,621 | $16,929 | $504 | $16,425 |
| 2014 | $2,124 | $14,017 | $394 | $13,623 |
| 2013 | $2,071 | $14,017 | $394 | $13,623 |
Source: Public Records
About This Building
Map
Nearby Homes
- 2 E Erie St Unit 2802
- 2 E Erie St Unit 3714
- 2 E Erie St Unit 3301
- 2 E Erie St Unit 1214
- 2 E Erie St Unit G549
- 2 E Erie St Unit G208A
- 2 E Erie St Unit 3712
- 21 E Huron St Unit 3301
- 21 E Huron St Unit 3601
- 21 E Huron St Unit 1806
- 21 E Huron St Unit 4701
- 21 E Huron St Unit 1407
- 630 N State St Unit 1709
- 630 N State St Unit 2403
- 630 N State St Unit P506
- 630 N State St Unit P426
- 10 E Ontario St Unit 3512
- 10 E Ontario St Unit 2702
- 10 E Ontario St Unit 1004
- 10 E Ontario St Unit PS515
- 630 N State St Unit 1106
- 630 N State St Unit 1001
- 630 N State St Unit 1508
- 630 N State St Unit P107
- 630 N State St Unit 1703
- 630 N State St Unit P433
- 630 N State St Unit P619
- 630 N State St Unit P116
- 630 N State St Unit 140102
- 630 N State St Unit 1008
- 630 N State St Unit P205
- 630 N State St Unit 270304
- 630 N State St Unit P212
- 630 N State St Unit P204
- 630 N State St Unit 2610
- 630 N State St Unit 2002
- 630 N State St Unit 1510
- 630 N State St Unit P407
- 630 N State St Unit 1604
- 630 N State St Unit 2508
Your Personal Tour Guide
Ask me questions while you tour the home.