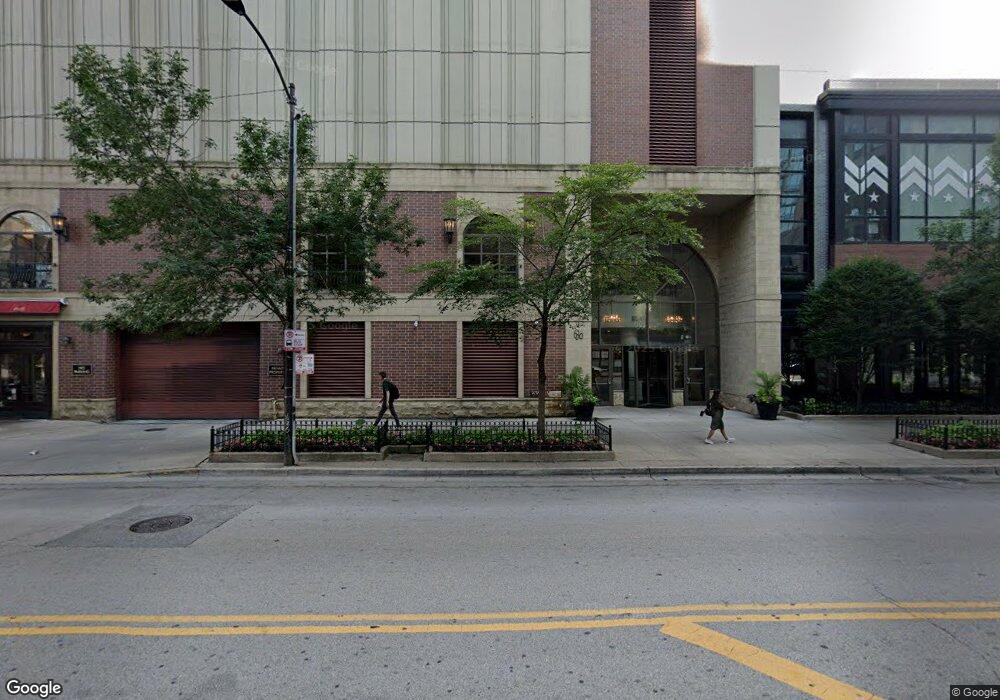
630 N State St, Unit 2002 Chicago, IL 60654
River North NeighborhoodEstimated Value: $439,000 - $570,000
2
Beds
2
Baths
--
Sq Ft
0.34
Acres
About This Home
This home is located at 630 N State St Unit 2002, Chicago, IL 60654 and is currently estimated at $490,966. 630 N State St Unit 2002 is a home located in Cook County with nearby schools including Ogden Elementary School, Wells Community Academy High School, and Muchin College Prep.
Ownership History
Date
Name
Owned For
Owner Type
Purchase Details
Closed on
May 14, 2008
Sold by
Bailey Mark L
Bought by
Biegansky Paul and Biegansky Marianne
Current Estimated Value
Purchase Details
Closed on
Feb 28, 2006
Sold by
Bailey Mark L
Bought by
Bailey Mark L and Mark L Bailey Revocable Trust
Purchase Details
Closed on
Jan 31, 2001
Sold by
630 North State Parkway Llc
Bought by
Bailey Mark I
Home Financials for this Owner
Home Financials are based on the most recent Mortgage that was taken out on this home.
Original Mortgage
$309,200
Interest Rate
7%
Create a Home Valuation Report for This Property
The Home Valuation Report is an in-depth analysis detailing your home's value as well as a comparison with similar homes in the area
Home Values in the Area
Average Home Value in this Area
Purchase History
| Date | Buyer | Sale Price | Title Company |
|---|---|---|---|
| Biegansky Paul | $437,500 | Cti | |
| Bailey Mark L | -- | None Available | |
| Bailey Mark I | $371,500 | -- |
Source: Public Records
Mortgage History
| Date | Status | Borrower | Loan Amount |
|---|---|---|---|
| Previous Owner | Bailey Mark I | $309,200 |
Source: Public Records
Tax History Compared to Growth
Tax History
| Year | Tax Paid | Tax Assessment Tax Assessment Total Assessment is a certain percentage of the fair market value that is determined by local assessors to be the total taxable value of land and additions on the property. | Land | Improvement |
|---|---|---|---|---|
| 2024 | $7,721 | $40,810 | $2,033 | $38,777 |
| 2023 | $7,488 | $42,565 | $1,640 | $40,925 |
| 2022 | $7,488 | $42,565 | $1,640 | $40,925 |
| 2021 | $7,548 | $43,532 | $1,639 | $41,893 |
| 2020 | $7,478 | $39,152 | $1,265 | $37,887 |
| 2019 | $7,300 | $42,507 | $1,265 | $41,242 |
| 2018 | $7,175 | $42,507 | $1,265 | $41,242 |
| 2017 | $6,479 | $36,173 | $1,077 | $35,096 |
| 2016 | $6,388 | $36,173 | $1,077 | $35,096 |
| 2015 | $6,629 | $36,173 | $1,077 | $35,096 |
| 2014 | $4,740 | $29,953 | $843 | $29,110 |
| 2013 | $4,628 | $29,953 | $843 | $29,110 |
Source: Public Records
About This Building
Map
Nearby Homes
- 630 N State St Unit 2204
- 630 N State St Unit 1406
- 630 N State St Unit 2205
- 630 N State St Unit 1909
- 630 N State St Unit P506
- 630 N State St Unit P413
- 10 E Ontario St Unit 2304
- 10 E Ontario St Unit 2306
- 10 E Ontario St Unit 2702
- 10 E Ontario St Unit 1208
- 10 E Ontario St Unit 4404
- 10 E Ontario St Unit 4703
- 10 E Ontario St Unit 4301
- 10 E Ontario St Unit 4208
- 10 E Ontario St Unit 4501
- 10 E Ontario St Unit 1806
- 10 E Ontario St Unit 3107
- 10 E Ontario St Unit 3305
- 10 E Ontario St Unit N-714
- 10 E Ontario St Unit PN705
- 630 N State St Unit 1106
- 630 N State St Unit 1508
- 630 N State St Unit P107
- 630 N State St Unit 1703
- 630 N State St Unit P433
- 630 N State St Unit P619
- 630 N State St Unit P116
- 630 N State St Unit 140102
- 630 N State St Unit 1008
- 630 N State St Unit P205
- 630 N State St Unit 270304
- 630 N State St Unit P212
- 630 N State St Unit P204
- 630 N State St Unit 2610
- 630 N State St Unit 2210
- 630 N State St Unit 1204
- 630 N State St Unit 1510
- 630 N State St Unit P407
- 630 N State St Unit 2508
- 630 N State St Unit 1203