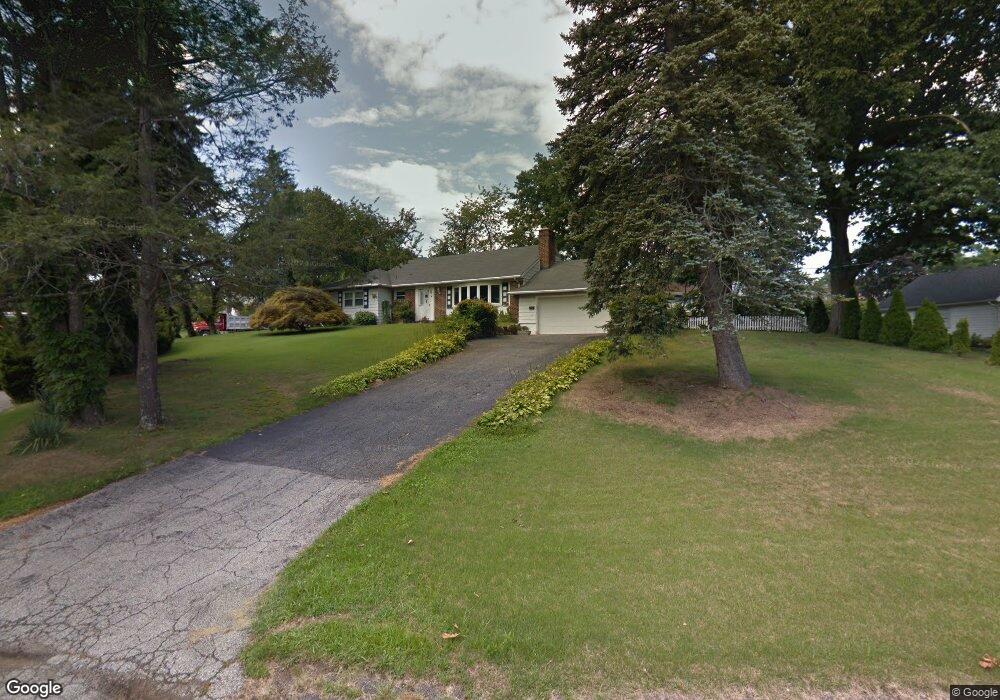
630 Pinebrook Blvd New Rochelle, NY 10804
Estimated Value: $901,000 - $1,010,412
3
Beds
2
Baths
1,404
Sq Ft
$691/Sq Ft
Est. Value
About This Home
This home is located at 630 Pinebrook Blvd, New Rochelle, NY 10804 and is currently estimated at $970,353, approximately $691 per square foot. 630 Pinebrook Blvd is a home located in Westchester County with nearby schools including William B. Ward Elementary School, Albert Leonard Middle School, and New Rochelle High School.
Ownership History
Date
Name
Owned For
Owner Type
Purchase Details
Closed on
Feb 27, 2020
Sold by
Harm Noel T and Harm May T
Bought by
Harm Noel T and Harm May T
Current Estimated Value
Home Financials for this Owner
Home Financials are based on the most recent Mortgage that was taken out on this home.
Original Mortgage
$385,000
Outstanding Balance
$327,341
Interest Rate
3.62%
Mortgage Type
New Conventional
Estimated Equity
$643,012
Purchase Details
Closed on
Jul 9, 1998
Sold by
Mendez Nelly
Bought by
Hann Noel T and Hann May T
Purchase Details
Closed on
Sep 5, 1997
Sold by
Vigilant Doorman Service Corp
Bought by
Mendez Nelly
Purchase Details
Closed on
Aug 15, 1996
Sold by
Ruben Bertram and Ruben Barbara
Bought by
Mendez Nelly
Create a Home Valuation Report for This Property
The Home Valuation Report is an in-depth analysis detailing your home's value as well as a comparison with similar homes in the area
Home Values in the Area
Average Home Value in this Area
Purchase History
| Date | Buyer | Sale Price | Title Company |
|---|---|---|---|
| Harm Noel T | -- | Liberty Land Abstract Inc | |
| Hann Noel T | $265,000 | Chicago Title Insurance Co | |
| Mendez Nelly | $205,000 | -- | |
| Mendez Nelly | $240,000 | Ticor Title Guarantee Compan |
Source: Public Records
Mortgage History
| Date | Status | Borrower | Loan Amount |
|---|---|---|---|
| Open | Harm Noel T | $385,000 |
Source: Public Records
Tax History Compared to Growth
Tax History
| Year | Tax Paid | Tax Assessment Tax Assessment Total Assessment is a certain percentage of the fair market value that is determined by local assessors to be the total taxable value of land and additions on the property. | Land | Improvement |
|---|---|---|---|---|
| 2024 | $17,799 | $12,620 | $6,800 | $5,820 |
| 2023 | $11,966 | $13,000 | $6,800 | $6,200 |
| 2022 | $13,215 | $13,000 | $6,800 | $6,200 |
| 2021 | $13,137 | $13,000 | $6,800 | $6,200 |
| 2020 | $10,570 | $13,000 | $6,800 | $6,200 |
| 2019 | $12,302 | $13,000 | $6,800 | $6,200 |
| 2018 | $10,149 | $13,000 | $6,800 | $6,200 |
| 2017 | $8,352 | $13,000 | $6,800 | $6,200 |
| 2016 | $12,612 | $13,000 | $6,800 | $6,200 |
| 2015 | $14,302 | $13,000 | $6,800 | $6,200 |
| 2014 | $14,302 | $13,000 | $6,800 | $6,200 |
| 2013 | $14,302 | $13,000 | $6,800 | $6,200 |
Source: Public Records
Map
Nearby Homes
- 629 Pinebrook Blvd
- 81 Winding Brook Rd
- 118 Winding Brook Rd
- 130 Woodhollow Ln
- 28 Hayhurst Rd
- 179 Van Etten Blvd
- 25 Woodhollow Ln
- 129 Hillandale Dr
- 290 Overlook Rd
- 100 Lord Kitchener Rd
- 2 Coventry Ct
- 7 Crestwood Ln
- 93 Hillandale Dr
- 2 Sackett Cir
- 45 Fenimore Rd
- 83 Fenimore Rd
- 149 Hanson Ln
- 98 Beverly Rd
- 90 Fenimore Rd
- 97 Beverly Rd
- 86 Alfred Ln
- 640 Pinebrook Blvd
- 620 Pinebrook Blvd
- 46 Fieldmere St
- 72 Alfred Ln
- 650 Pinebrook Blvd
- 45 Avis Dr
- 43 Fieldmere St
- 637 Pinebrook Blvd
- 38 Fieldmere St
- 64 Alfred Ln
- 621 Pinebrook Blvd
- 645 Pinebrook Blvd
- 37 Avis Dr
- 658 Pinebrook Blvd
- 610 Pinebrook Blvd
- 46 Avis Dr
- 613 Pinebrook Blvd
- 35 Fieldmere St
- 56 Alfred Ln