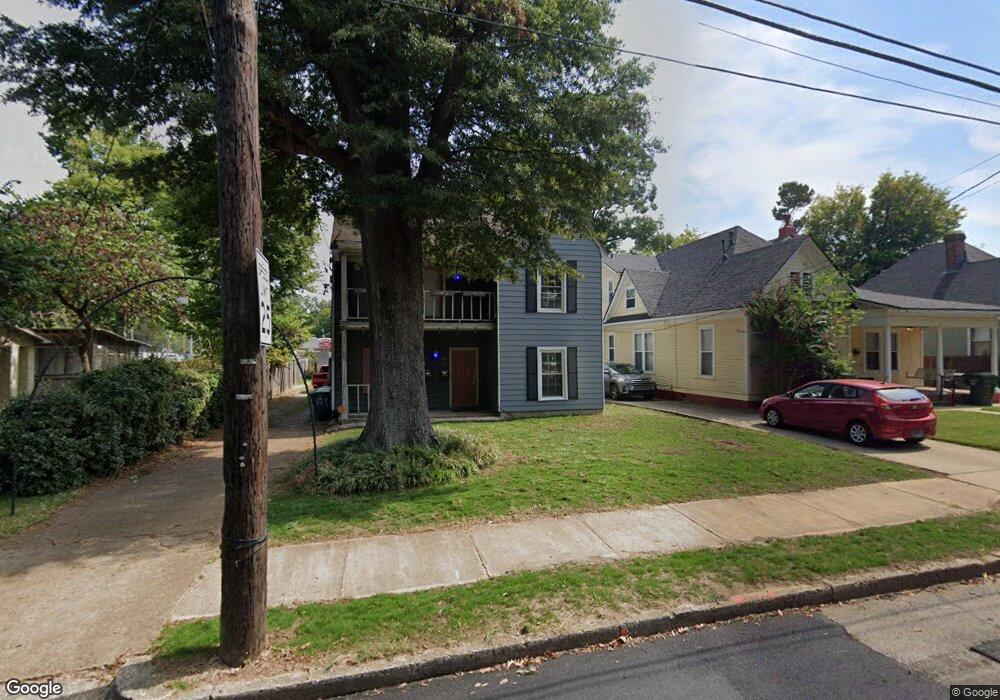
630 S Cox St Memphis, TN 38104
Cooper-Young NeighborhoodEstimated Value: $296,000 - $380,000
4
Beds
2
Baths
2,552
Sq Ft
$134/Sq Ft
Est. Value
About This Home
This home is located at 630 S Cox St, Memphis, TN 38104 and is currently estimated at $343,203, approximately $134 per square foot. 630 S Cox St is a home located in Shelby County with nearby schools including Idlewild Elementary School, Central High School, and Compass Community School Midtown Campus.
Ownership History
Date
Name
Owned For
Owner Type
Purchase Details
Closed on
Feb 22, 2007
Sold by
Jones Robert M and Jones Elizabeth H
Bought by
Katzev Scott H
Current Estimated Value
Home Financials for this Owner
Home Financials are based on the most recent Mortgage that was taken out on this home.
Original Mortgage
$135,000
Outstanding Balance
$80,859
Interest Rate
6.16%
Mortgage Type
Purchase Money Mortgage
Estimated Equity
$262,344
Purchase Details
Closed on
Jul 21, 2006
Sold by
Sims Realty Inc
Bought by
Jones Ii Robert M and Jones Elizabeth H
Home Financials for this Owner
Home Financials are based on the most recent Mortgage that was taken out on this home.
Original Mortgage
$148,000
Interest Rate
6.6%
Mortgage Type
Purchase Money Mortgage
Purchase Details
Closed on
Feb 8, 2006
Sold by
Burden Chester L and Burden Donna M
Bought by
Sims Realty Inc and Payne Paul
Purchase Details
Closed on
Jun 12, 1998
Sold by
Larson Phillip A
Bought by
Larson Jane C
Create a Home Valuation Report for This Property
The Home Valuation Report is an in-depth analysis detailing your home's value as well as a comparison with similar homes in the area
Home Values in the Area
Average Home Value in this Area
Purchase History
| Date | Buyer | Sale Price | Title Company |
|---|---|---|---|
| Katzev Scott H | $215,000 | None Available | |
| Jones Ii Robert M | $185,000 | Edco Title & Closing Service | |
| Sims Realty Inc | $118,600 | None Available | |
| Larson Jane C | -- | -- |
Source: Public Records
Mortgage History
| Date | Status | Borrower | Loan Amount |
|---|---|---|---|
| Open | Katzev Scott H | $135,000 | |
| Previous Owner | Jones Ii Robert M | $148,000 |
Source: Public Records
Tax History Compared to Growth
Tax History
| Year | Tax Paid | Tax Assessment Tax Assessment Total Assessment is a certain percentage of the fair market value that is determined by local assessors to be the total taxable value of land and additions on the property. | Land | Improvement |
|---|---|---|---|---|
| 2025 | $2,050 | $86,350 | $13,475 | $72,875 |
| 2024 | $2,050 | $60,475 | $9,200 | $51,275 |
| 2023 | $3,684 | $60,475 | $9,200 | $51,275 |
| 2022 | $3,684 | $60,475 | $9,200 | $51,275 |
| 2021 | $3,727 | $60,475 | $9,200 | $51,275 |
| 2020 | $3,873 | $53,450 | $9,200 | $44,250 |
| 2019 | $3,873 | $53,450 | $9,200 | $44,250 |
| 2018 | $3,873 | $53,450 | $9,200 | $44,250 |
| 2017 | $2,197 | $53,450 | $9,200 | $44,250 |
| 2016 | $2,156 | $49,325 | $0 | $0 |
| 2014 | $2,070 | $47,375 | $0 | $0 |
Source: Public Records
Map
Nearby Homes
- 2188 Cowden Ave
- 2197 Cowden Ave
- 2242 Vinton Ave
- 2275 Edgewood Cove
- 2284 Edgewood Cove
- 615 East Pkwy S
- 585 E Parkway S Unit 8
- 585 E Parkway S Unit 5
- 521 Summitt St
- 519 Summitt St
- 710 Philadelphia St
- 2113 Vinton Ave
- 2106 Higbee Ave
- 2100 Higbee Ave
- 2080 Vinton Ave
- 2277 Union Ave Unit 304
- 2277 Union Ave Unit 502
- 2277 Union Ave Unit 105
- 2241 York Ave
- 2065 Peabody Ave