Estimated Value: $863,536 - $1,034,000
3
Beds
3
Baths
1,842
Sq Ft
$498/Sq Ft
Est. Value
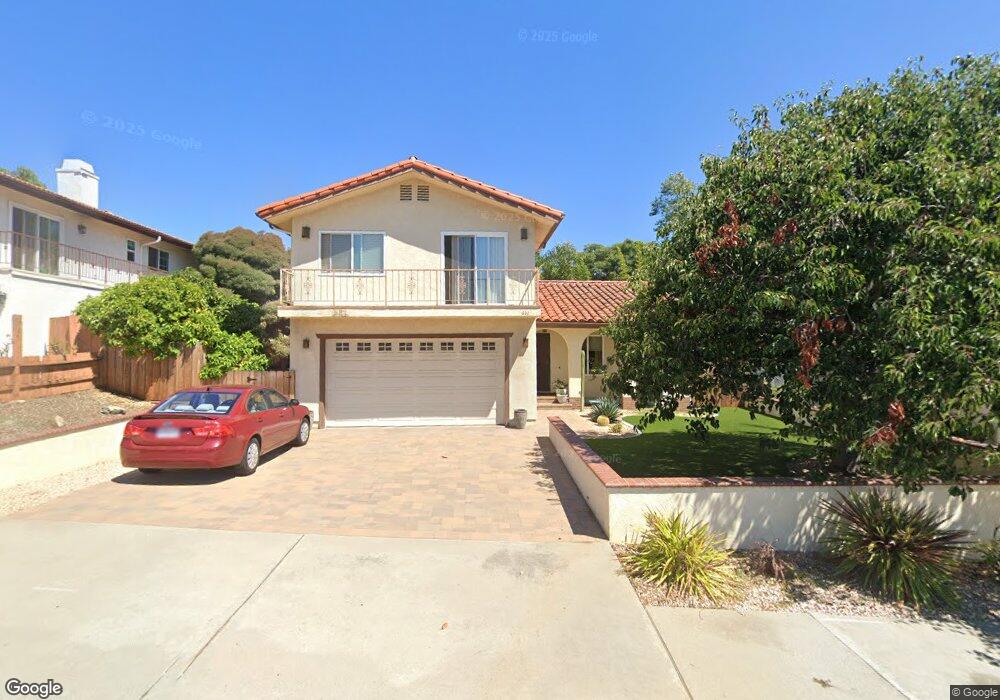
About This Home
This home is located at 630 Sabrina Way, Vista, CA 92084 and is currently estimated at $917,634, approximately $498 per square foot. 630 Sabrina Way is a home located in San Diego County with nearby schools including Beaumont Elementary School, Rancho Minerva Middle School, and Vista High School.
Ownership History
Date
Name
Owned For
Owner Type
Purchase Details
Closed on
Feb 11, 2016
Sold by
York Lorrie L
Bought by
York Lorrie L
Current Estimated Value
Purchase Details
Closed on
Dec 16, 1994
Sold by
Emc Mtg Corp
Bought by
York Lorrie L
Home Financials for this Owner
Home Financials are based on the most recent Mortgage that was taken out on this home.
Original Mortgage
$130,500
Interest Rate
9.2%
Purchase Details
Closed on
Oct 25, 1993
Sold by
California Reconveyance Company
Bought by
Emc Mtg Corp
Purchase Details
Closed on
Jul 25, 1991
Purchase Details
Closed on
Nov 20, 1990
Purchase Details
Closed on
Nov 6, 1990
Purchase Details
Closed on
Jul 28, 1988
Purchase Details
Closed on
Sep 18, 1987
Create a Home Valuation Report for This Property
The Home Valuation Report is an in-depth analysis detailing your home's value as well as a comparison with similar homes in the area
Home Values in the Area
Average Home Value in this Area
Purchase History
| Date | Buyer | Sale Price | Title Company |
|---|---|---|---|
| York Lorrie L | -- | None Available | |
| York Lorrie L | $145,000 | Fidelity National Title Ins | |
| Emc Mtg Corp | $133,526 | Chicago Title | |
| -- | $219,000 | -- | |
| -- | $215,000 | -- | |
| -- | $200,000 | -- | |
| -- | $135,000 | -- | |
| -- | $115,000 | -- |
Source: Public Records
Mortgage History
| Date | Status | Borrower | Loan Amount |
|---|---|---|---|
| Closed | York Lorrie L | $130,500 |
Source: Public Records
Tax History Compared to Growth
Tax History
| Year | Tax Paid | Tax Assessment Tax Assessment Total Assessment is a certain percentage of the fair market value that is determined by local assessors to be the total taxable value of land and additions on the property. | Land | Improvement |
|---|---|---|---|---|
| 2025 | $3,299 | $243,521 | $91,317 | $152,204 |
| 2024 | $3,299 | $238,747 | $89,527 | $149,220 |
| 2023 | $3,235 | $234,067 | $87,772 | $146,295 |
| 2022 | $3,227 | $229,478 | $86,051 | $143,427 |
| 2021 | $3,157 | $224,979 | $84,364 | $140,615 |
| 2020 | $3,134 | $222,673 | $83,499 | $139,174 |
| 2019 | $2,417 | $218,308 | $81,862 | $136,446 |
| 2018 | $2,972 | $214,028 | $80,257 | $133,771 |
| 2017 | $122 | $209,833 | $78,684 | $131,149 |
| 2016 | $2,861 | $205,720 | $77,142 | $128,578 |
| 2015 | $2,841 | $202,631 | $75,984 | $126,647 |
| 2014 | $2,775 | $198,663 | $74,496 | $124,167 |
Source: Public Records
Map
Nearby Homes
- 907 Westport Ln
- 814 Sierra Verde Dr
- 935 Crescent Dr
- 436 Avalon Dr
- 383 Morningside Terrace
- 0 Eucalyptus Ave
- 157-59 Natal Way
- 482 Oceanview View Dr
- 955 Postal Way Unit 34
- 223 Vista Glen Ln
- 840 Sinkler Way
- 211 Civic Center Dr
- 209 Civic Center Dr
- 490 Lado de Loma Dr
- 969 Marlin Dr
- 940 Marlin Dr
- 240 Casper Ln
- 2175 Alta Vista Dr
- 0 Nostalgia Place Unit 23522
- 215 Guajome St
- 636 Sabrina Way
- 624 Sabrina Way
- 644 Sabrina Way
- 618 Sabrina Way
- 821 Crescent Dr
- 819 Crescent Dr
- 627 Sabrina Way
- 906 Westport Ln
- 645 Sabrina Way
- 633 Sabrina Way
- 621 Sabrina Way
- 639 Sabrina Way
- 610 Sabrina Way
- 904 Westport Ln
- 649 Sabrina Way
- 817 Crescent Dr
- 902 Westport Ln
- 604 Sabrina Way
- 609 Sabrina Way
- 815 Crescent Dr