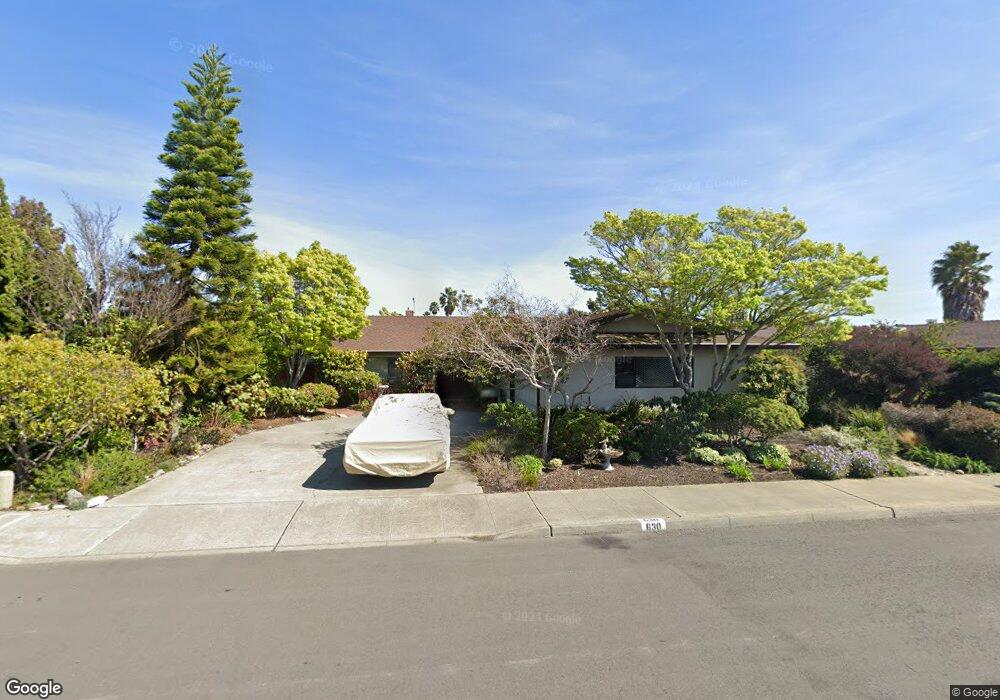
630 Sand Hook Isle Alameda, CA 94501
South Shore NeighborhoodEstimated Value: $1,238,626 - $1,517,000
4
Beds
2
Baths
1,841
Sq Ft
$741/Sq Ft
Est. Value
About This Home
This home is located at 630 Sand Hook Isle, Alameda, CA 94501 and is currently estimated at $1,364,157, approximately $740 per square foot. 630 Sand Hook Isle is a home located in Alameda County with nearby schools including Franklin Elementary, Will C. Wood Middle School, and Encinal Junior/Senior High.
Ownership History
Date
Name
Owned For
Owner Type
Purchase Details
Closed on
Mar 16, 2006
Sold by
Stanley Ronald W and Stanley Penny L
Bought by
Stanley Ronald W and Stanley Penny L
Current Estimated Value
Purchase Details
Closed on
Jul 27, 1999
Sold by
Stanley Ronald W
Bought by
Stanley Ronald W and Stanley Penny L
Home Financials for this Owner
Home Financials are based on the most recent Mortgage that was taken out on this home.
Original Mortgage
$125,000
Interest Rate
7.7%
Mortgage Type
Credit Line Revolving
Create a Home Valuation Report for This Property
The Home Valuation Report is an in-depth analysis detailing your home's value as well as a comparison with similar homes in the area
Home Values in the Area
Average Home Value in this Area
Purchase History
| Date | Buyer | Sale Price | Title Company |
|---|---|---|---|
| Stanley Ronald W | -- | None Available | |
| Stanley Ronald W | -- | -- |
Source: Public Records
Mortgage History
| Date | Status | Borrower | Loan Amount |
|---|---|---|---|
| Previous Owner | Stanley Ronald W | $125,000 |
Source: Public Records
Tax History
| Year | Tax Paid | Tax Assessment Tax Assessment Total Assessment is a certain percentage of the fair market value that is determined by local assessors to be the total taxable value of land and additions on the property. | Land | Improvement |
|---|---|---|---|---|
| 2025 | $2,866 | $132,888 | $64,479 | $75,409 |
| 2024 | $2,866 | $130,146 | $63,215 | $73,931 |
| 2023 | $2,762 | $134,456 | $61,975 | $72,481 |
| 2022 | $2,692 | $124,820 | $60,760 | $71,060 |
| 2021 | $2,627 | $122,236 | $59,569 | $69,667 |
| 2020 | $2,588 | $127,911 | $58,958 | $68,953 |
| 2019 | $2,487 | $125,404 | $57,803 | $67,601 |
| 2018 | $2,425 | $122,945 | $56,669 | $66,276 |
| 2017 | $2,334 | $120,534 | $55,558 | $64,976 |
| 2016 | $2,311 | $118,172 | $54,469 | $63,703 |
| 2015 | $2,291 | $116,397 | $53,651 | $62,746 |
| 2014 | $2,161 | $114,117 | $52,600 | $61,517 |
Source: Public Records
Map
Nearby Homes
- 955 Shorepoint Ct Unit 100
- 955 Shorepoint Ct Unit 216
- 1122 Bay St
- 960 Shorepoint Ct Unit 215
- 1003 Morton St
- 1000 Central Ave
- 824 Paru St
- 1203 Benton St
- 1500 Alameda Ave Unit G
- 1512 Mozart St
- 1211 Paru St
- 1305 Webster St Unit C202
- 1305 Webster St Unit C102
- 1523 Verdi St
- 1333 Webster St Unit A107
- 1321 Webster St Unit D103
- 1321 Webster St Unit D119
- 1321 Webster St Unit D319
- 610 Grand St
- 1822 Clinton Ave
- 624 Sand Hook Isle
- 636 Sand Hook Isle
- 618 Sand Hook Isle
- 633 Sand Hook Isle
- 644 Sand Hook Isle
- 627 Sand Hook Isle
- 639 Sand Hook Isle
- 612 Sand Hook Isle
- 621 Sand Hook Isle
- 651 Sand Hook Isle
- 645 Sand Hook Isle
- 633 Larchmont Isle
- 627 Larchmont Isle
- 615 Sand Hook Isle
- 608 Sand Hook Isle
- 639 Larchmont Isle
- 621 Larchmont Isle
- 615 Larchmont Isle
- 600 Sand Hook Isle
- 607 Sand Hook Isle
Your Personal Tour Guide
Ask me questions while you tour the home.