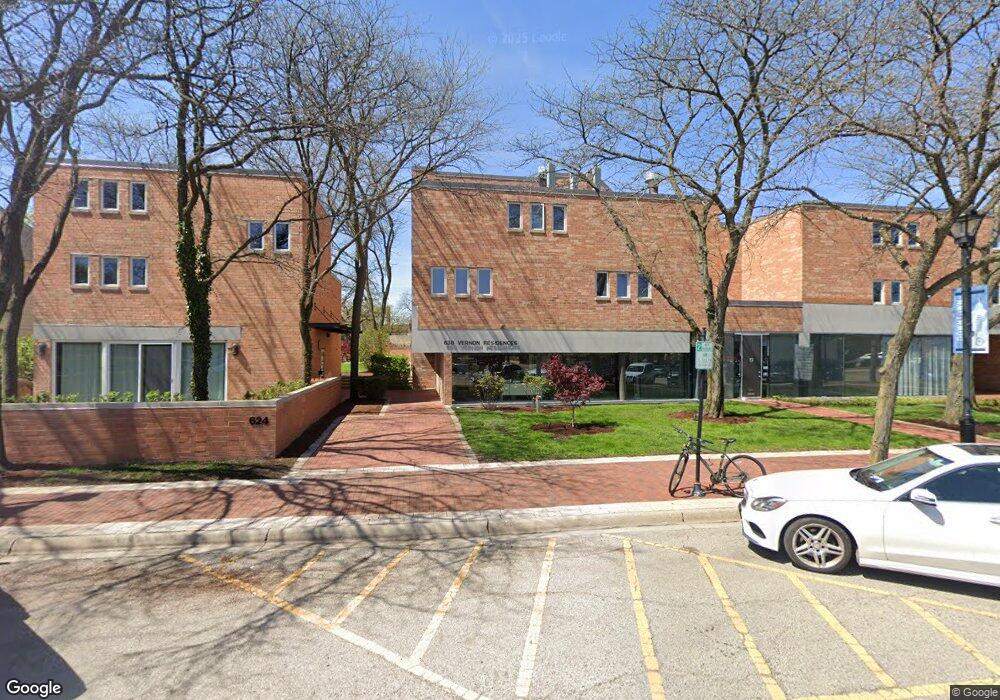
630 Vernon Ave Unit 1 Glencoe, IL 60022
Estimated Value: $353,509 - $450,000
2
Beds
--
Bath
1,320
Sq Ft
$311/Sq Ft
Est. Value
About This Home
This home is located at 630 Vernon Ave Unit 1, Glencoe, IL 60022 and is currently estimated at $411,127, approximately $311 per square foot. 630 Vernon Ave Unit 1 is a home located in Cook County with nearby schools including South Elementary School, Central School, and West School.
Ownership History
Date
Name
Owned For
Owner Type
Purchase Details
Closed on
May 11, 2015
Sold by
Stonov Alexander L
Bought by
Sakol Kathryn B
Current Estimated Value
Purchase Details
Closed on
Jan 24, 2004
Sold by
Stonov Alexander L and Guz Irina
Bought by
Stonov Alexander L
Home Financials for this Owner
Home Financials are based on the most recent Mortgage that was taken out on this home.
Original Mortgage
$269,600
Interest Rate
5.96%
Mortgage Type
New Conventional
Purchase Details
Closed on
Jul 11, 2002
Sold by
Guz Irina
Bought by
Guz Irina and Stonov Alexander L
Purchase Details
Closed on
Mar 7, 1996
Sold by
American National Bk & Tr Co Of Chicago
Bought by
Thompson Frederica M
Home Financials for this Owner
Home Financials are based on the most recent Mortgage that was taken out on this home.
Original Mortgage
$164,400
Interest Rate
6.98%
Create a Home Valuation Report for This Property
The Home Valuation Report is an in-depth analysis detailing your home's value as well as a comparison with similar homes in the area
Home Values in the Area
Average Home Value in this Area
Purchase History
We collect this data history from publicly available records. To have your information removed, we recommend requesting removal directly through your county’s website.
| Date | Buyer | Sale Price | Title Company |
|---|---|---|---|
| Sakol Kathryn B | $240,000 | Ct | |
| Stonov Alexander L | -- | Chicago Title Insurance Comp | |
| Guz Irina | -- | -- | |
| Thompson Frederica M | $195,500 | Ticor Title Insurance |
Source: Public Records
Mortgage History
We collect this data history from publicly available records. To have your information removed, we recommend requesting removal directly through your county’s website.
| Date | Status | Borrower | Loan Amount |
|---|---|---|---|
| Previous Owner | Stonov Alexander L | $269,600 | |
| Previous Owner | Thompson Frederica M | $164,400 |
Source: Public Records
Tax History
| Year | Tax Paid | Tax Assessment Tax Assessment Total Assessment is a certain percentage of the fair market value that is determined by local assessors to be the total taxable value of land and additions on the property. | Land | Improvement |
|---|---|---|---|---|
| 2025 | $5,657 | $38,458 | $3,250 | $35,208 |
| 2024 | $5,657 | $29,061 | $2,750 | $26,311 |
| 2023 | $5,238 | $29,061 | $2,750 | $26,311 |
| 2022 | $5,238 | $29,061 | $2,750 | $26,311 |
| 2021 | $5,043 | $23,585 | $2,250 | $21,335 |
| 2020 | $5,010 | $23,585 | $2,250 | $21,335 |
| 2019 | $4,821 | $25,665 | $2,250 | $23,415 |
| 2018 | $4,914 | $22,764 | $1,875 | $20,889 |
| 2017 | $4,788 | $22,764 | $1,875 | $20,889 |
| 2016 | $4,699 | $22,764 | $1,875 | $20,889 |
| 2015 | $4,534 | $19,935 | $1,562 | $18,373 |
| 2014 | $4,436 | $19,935 | $1,562 | $18,373 |
| 2013 | $4,217 | $19,935 | $1,562 | $18,373 |
Source: Public Records
Map
Nearby Homes
- 315 Hawthorn Ave Unit E
- 430 South Ave
- 378 South Ave
- 476 Park Ave
- 488 Park Ave
- 794 Greenwood Ave
- 437 Jefferson Ave
- 64 Crescent Dr
- 395 Greenleaf Ave
- 120 Crescent Dr
- 396 Sheridan Rd
- 255 Harbor St
- 599 Woodlawn Ave
- 1018 Eastwood Rd
- 445 Sunset Ln
- 1076 Old Elm Ln
- 231 Woodlawn Ave
- 1114 Old Elm Ln
- 1368 Scott Ave
- 1125 Elm Ridge Dr
- 630 Vernon Ave
- 630 Vernon Ave
- 630 Vernon Ave
- 630 Vernon Ave
- 630 Vernon Ave Unit 907
- 630 Vernon Ave Unit 17
- 630 Vernon Ave Unit 4
- 630 Vernon Ave Unit 18
- 630 Vernon Ave Unit 8
- 630 Vernon Ave Unit 15
- 630 Vernon Ave Unit 5
- 630 Vernon Ave Unit 16
- 630 Vernon Ave Unit 13
- 630 Vernon Ave Unit 7
- 630 Vernon Ave Unit 3
- 630 Vernon Ave Unit 11
- 630 Vernon Ave Unit 6
- 630 Vernon Ave Unit 14
- 630 Vernon Ave Unit 12
- 630 Vernon Ave Unit 9
Your Personal Tour Guide
Ask me questions while you tour the home.