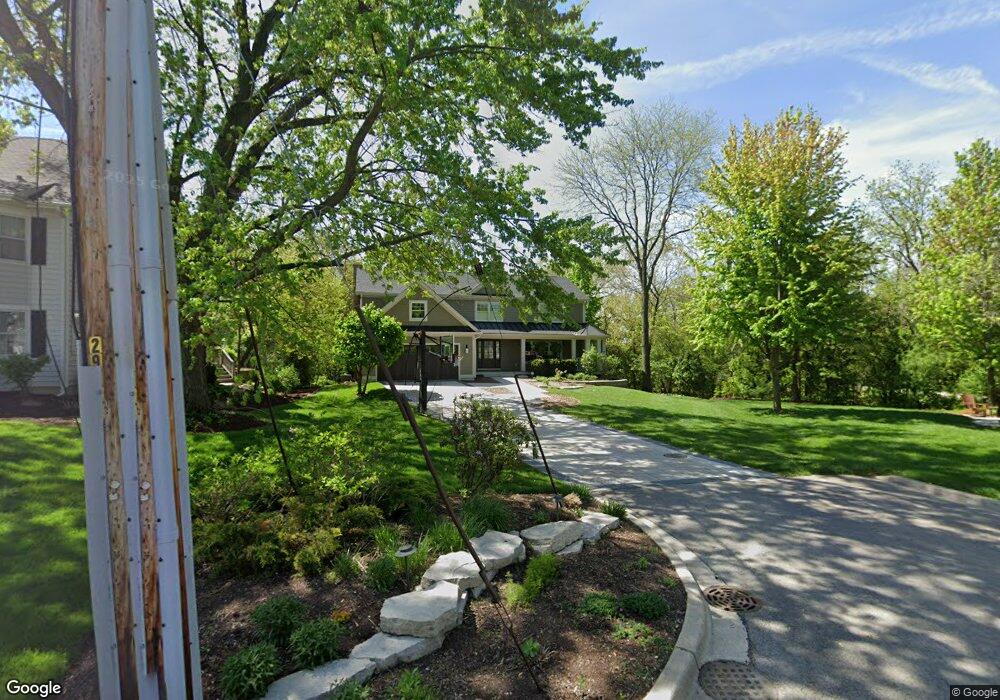
630 W Franklin St Wheaton, IL 60187
Downtown Wheaton NeighborhoodEstimated Value: $1,018,000 - $1,543,000
4
Beds
4
Baths
3,800
Sq Ft
$325/Sq Ft
Est. Value
About This Home
This home is located at 630 W Franklin St, Wheaton, IL 60187 and is currently estimated at $1,236,442, approximately $325 per square foot. 630 W Franklin St is a home located in DuPage County with nearby schools including Longfellow Elementary School, Franklin Middle School, and Wheaton North High School.
Ownership History
Date
Name
Owned For
Owner Type
Purchase Details
Closed on
Apr 21, 2015
Sold by
Piro David C and Piro Emily W
Bought by
Piro Living Trust
Current Estimated Value
Purchase Details
Closed on
Jun 9, 2010
Sold by
Woerner Chris and Woerner Sangita
Bought by
Piro David C and Piro Emily W
Home Financials for this Owner
Home Financials are based on the most recent Mortgage that was taken out on this home.
Original Mortgage
$417,000
Outstanding Balance
$277,548
Interest Rate
4.83%
Mortgage Type
New Conventional
Estimated Equity
$958,894
Purchase Details
Closed on
Jun 8, 2010
Sold by
Woemer Chris and Chris Woerner Trust
Bought by
Woerner Chis and Woerner Sangita
Home Financials for this Owner
Home Financials are based on the most recent Mortgage that was taken out on this home.
Original Mortgage
$417,000
Outstanding Balance
$277,548
Interest Rate
4.83%
Mortgage Type
New Conventional
Estimated Equity
$958,894
Purchase Details
Closed on
Nov 20, 2007
Sold by
Woerner Christian K and Woerner Sangita C
Bought by
Woerner Chris and Chris Woerner Trust
Purchase Details
Closed on
May 23, 2006
Sold by
Andrea Partners Llc
Bought by
Woerner Christian K and Woerner Sangita C
Home Financials for this Owner
Home Financials are based on the most recent Mortgage that was taken out on this home.
Original Mortgage
$375,000
Interest Rate
6.66%
Mortgage Type
Fannie Mae Freddie Mac
Purchase Details
Closed on
Aug 23, 2005
Sold by
Fyock Daniel E and Fyock Mary Ellen
Bought by
Andrea Partners Llc
Home Financials for this Owner
Home Financials are based on the most recent Mortgage that was taken out on this home.
Original Mortgage
$504,000
Interest Rate
6.01%
Mortgage Type
Purchase Money Mortgage
Purchase Details
Closed on
Jun 28, 2001
Sold by
The Daniel E & Mary Ellen Fyock Living T
Bought by
Fyock Daniel E and Fyock Mary Ellen
Home Financials for this Owner
Home Financials are based on the most recent Mortgage that was taken out on this home.
Original Mortgage
$222,320
Interest Rate
6.25%
Purchase Details
Closed on
Jun 21, 1999
Sold by
Fyock Daniel E and Fyock Mary Ellen
Bought by
Daniel E & Mary Ellen Fyock Living Trust
Create a Home Valuation Report for This Property
The Home Valuation Report is an in-depth analysis detailing your home's value as well as a comparison with similar homes in the area
Home Values in the Area
Average Home Value in this Area
Purchase History
| Date | Buyer | Sale Price | Title Company |
|---|---|---|---|
| Piro Living Trust | -- | None Available | |
| Piro David C | $730,000 | None Available | |
| Woerner Chis | -- | None Available | |
| Woerner Chris | -- | None Available | |
| Woerner Christian K | $840,000 | Ticor Title Insurance Compan | |
| Andrea Partners Llc | $630,000 | Burnet Title Llc | |
| Fyock Daniel E | -- | -- | |
| Daniel E & Mary Ellen Fyock Living Trust | -- | -- |
Source: Public Records
Mortgage History
| Date | Status | Borrower | Loan Amount |
|---|---|---|---|
| Open | Piro David C | $417,000 | |
| Previous Owner | Woerner Christian K | $375,000 | |
| Previous Owner | Andrea Partners Llc | $504,000 | |
| Previous Owner | Fyock Daniel E | $222,320 |
Source: Public Records
Tax History
| Year | Tax Paid | Tax Assessment Tax Assessment Total Assessment is a certain percentage of the fair market value that is determined by local assessors to be the total taxable value of land and additions on the property. | Land | Improvement |
|---|---|---|---|---|
| 2024 | $17,963 | $311,710 | $82,436 | $229,274 |
| 2023 | $17,553 | $267,730 | $75,880 | $191,850 |
| 2022 | $17,107 | $253,020 | $71,710 | $181,310 |
| 2021 | $17,058 | $247,020 | $70,010 | $177,010 |
| 2020 | $17,008 | $244,720 | $69,360 | $175,360 |
| 2019 | $16,628 | $238,260 | $67,530 | $170,730 |
| 2018 | $16,313 | $231,230 | $63,630 | $167,600 |
| 2017 | $16,083 | $222,700 | $61,280 | $161,420 |
| 2016 | $15,883 | $213,800 | $58,830 | $154,970 |
| 2015 | $14,095 | $182,850 | $56,120 | $126,730 |
| 2014 | $15,139 | $192,710 | $27,750 | $164,960 |
| 2013 | $14,749 | $193,290 | $27,830 | $165,460 |
Source: Public Records
Map
Nearby Homes
- 606 W Franklin St
- 524 Western Ave
- 0N105 Lot 1 Nepil Ave
- 0N105 Lot 2 Nepil Ave
- 100 N Gary Ave Unit 408
- 405 W Front St Unit 3207
- 933 Wheaton Oaks Dr
- 1310 N Carlton Ave
- 1037 Wheaton Oaks Dr
- 522 S West St
- 536 W Evergreen St
- 520 S Wheaton Ave
- 114 W Prairie Ave
- 315 S Morgan Ave
- 312 E Lincoln Ave
- 314 E Jefferson Ave
- 111 W Prairie Ave
- 1115 N Main St
- 705 S Gables Blvd
- 353 E Liberty Dr
- 500 N Carlton St
- 628 W Franklin St
- 624 W Franklin St
- 614 W Franklin St
- 618 W Franklin St
- 506 N Carlton Ave
- 419 Western Ave
- 417 Western Ave
- 506 N Carlton St
- 413 Western Ave
- 629 W Franklin St
- 610 W Franklin St
- 425 Western Ave
- 616 W Franklin St
- 511 N Carlton St
- 431 Western Ave
- 510 N Carlton St
- 612 W Franklin St
- 612 W Franklin St
- 403 Western Ave
Your Personal Tour Guide
Ask me questions while you tour the home.