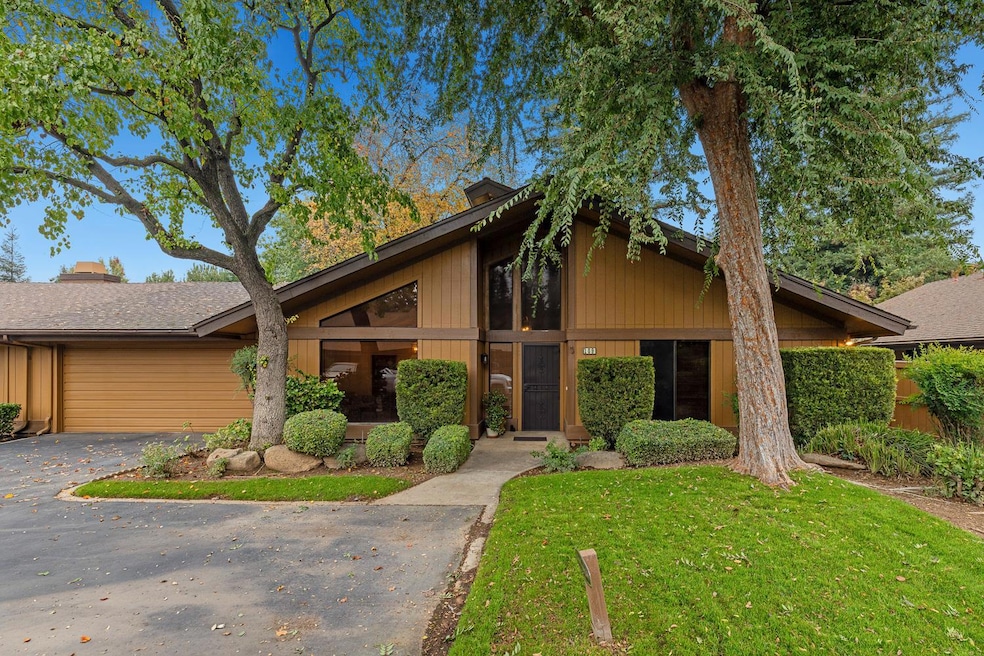
6300 N Palm Ave Unit 109 Fresno, CA 93704
Bullard NeighborhoodEstimated payment $2,506/month
Highlights
- In Ground Pool
- Clubhouse
- Tennis Courts
- Gated Community
- Mature Landscaping
- Fenced Yard
About This Home
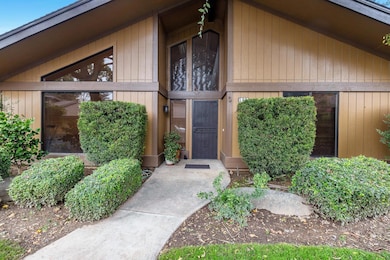
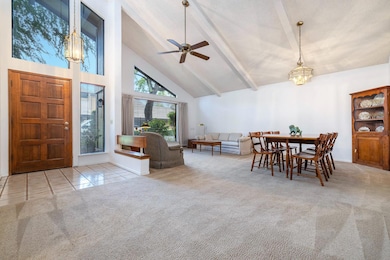
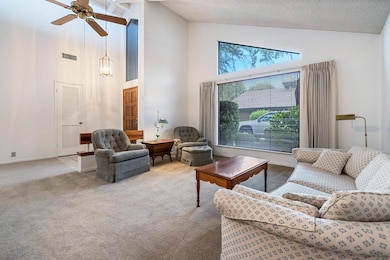
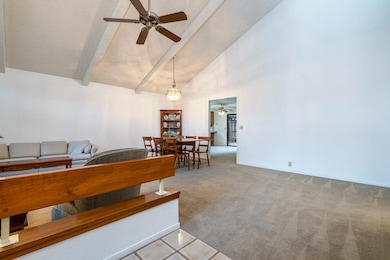
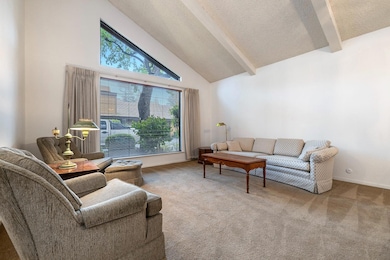
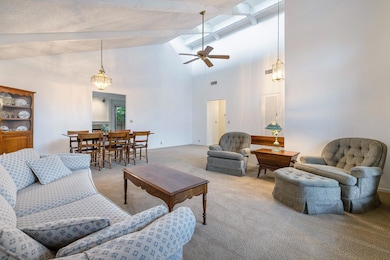
Welcome Home to The Fig Gardens, a beautifully maintained and mature landscaped gated Community. Wonderful location close to Fig Garden Village, River Park Shopping, Woodward Park and Hwy 41. Very esthetic community with wandering roadways to units and mature landscaping. Best Unit location in complex with no backyard neighbors and close to the Pool, Clubhouse, Tennis Courts and Mailbox. Situated at the end of a cul-de-sac with Guest Parking in front of Unit. Very Spacious Entry, Living and Dining Area with Vaulted Beamed Ceiling. Light and Airy with clearstory windows. Additional high Angled windows above Entry Door and Living Room Picture window. Family Room with fireplace and picture window viewing charming Patio/Garden Area. Breakfast Nook off Kitchen and Living Room for secondary dining area. Wet bar also available in those areas. Kitchen has been updated with newer tile counter top and stainless finish Dishwasher, Oven and Microwave Oven. Lots of counter space and cabinetry. Kitchen Sink Greenhouse Window also featured. Nook Area has a sliding glass door onto private and inviting Patio Area. Beautifully appointed and landscaped Patio with a Garden Bench Pergola adding additional Charm. Nice size Laundry Room with Utility Sink, Pantry and additional upper storage cabinets above washer and dryer. Large 2 car garage completely sheet rooked with sectional roll up garage door with automatic opener. Abundant additional built-in storage Cabinets and storage closet in garage. Master Bedroom is also spacious w/a vaulted ceiling and sliding glass door opening onto patio/garden area. Full wall of closets w/mirror doors. Master bath has been remodeled with a floor level walk-in shower. Newer Vanity tiled counter top and floor tile. Guest Bedroom is also large with a full wall of closets with mirrored door. Guest Bath has a tub/shower combination. There is also a whole house fan to be enjoyed. This is a very unique complex with an active HOA that organizes community events. Very quiet and peaceful atmosphere perfect for daily exercise activities. This unit has a back gate in Patio Area conveniently located to mailbox and pool/clubhouse area.
Property Details
Home Type
- Condominium
Est. Annual Taxes
- $3,531
Year Built
- Built in 1980
Lot Details
- Fenced Yard
- Mature Landscaping
- Sprinkler System
HOA Fees
- $395 Monthly HOA Fees
Parking
- Automatic Garage Door Opener
Home Design
- Concrete Foundation
- Composition Roof
- Wood Siding
Interior Spaces
- 1,736 Sq Ft Home
- 1-Story Property
- Zero Clearance Fireplace
- Family Room
- Living Room
- Laundry in Utility Room
Kitchen
- Eat-In Kitchen
- Microwave
- Dishwasher
- Trash Compactor
- Disposal
Flooring
- Carpet
- Tile
Bedrooms and Bathrooms
- 2 Bedrooms
- 2 Bathrooms
- Bathtub with Shower
- Separate Shower
Accessible Home Design
- Low Threshold Shower
- Wheelchair Access
- Level Entry For Accessibility
Pool
- In Ground Pool
- Fence Around Pool
- Gunite Pool
Additional Features
- Brick Porch or Patio
- Central Heating and Cooling System
Community Details
Overview
- Greenbelt
Recreation
- Tennis Courts
- Community Pool
- Community Spa
Additional Features
- Clubhouse
- Gated Community
Map
Home Values in the Area
Average Home Value in this Area
Tax History
| Year | Tax Paid | Tax Assessment Tax Assessment Total Assessment is a certain percentage of the fair market value that is determined by local assessors to be the total taxable value of land and additions on the property. | Land | Improvement |
|---|---|---|---|---|
| 2025 | $3,531 | $278,534 | $69,632 | $208,902 |
| 2023 | $3,395 | $267,720 | $66,929 | $200,791 |
| 2022 | $3,282 | $262,471 | $65,617 | $196,854 |
| 2021 | $3,190 | $257,326 | $64,331 | $192,995 |
| 2020 | $3,175 | $254,689 | $63,672 | $191,017 |
| 2019 | $3,051 | $249,696 | $62,424 | $187,272 |
| 2018 | $3,001 | $244,800 | $61,200 | $183,600 |
| 2017 | $2,571 | $204,217 | $50,777 | $153,440 |
| 2016 | $2,487 | $200,214 | $49,782 | $150,432 |
| 2015 | $2,449 | $197,208 | $49,035 | $148,173 |
| 2014 | $2,402 | $193,346 | $48,075 | $145,271 |
Property History
| Date | Event | Price | List to Sale | Price per Sq Ft |
|---|---|---|---|---|
| 11/25/2025 11/25/25 | For Sale | $345,000 | -- | $199 / Sq Ft |
Purchase History
| Date | Type | Sale Price | Title Company |
|---|---|---|---|
| Grant Deed | $240,000 | Placer Title Fresno | |
| Grant Deed | $185,000 | Placer Title Company | |
| Interfamily Deed Transfer | -- | -- | |
| Quit Claim Deed | $100,000 | -- |
Mortgage History
| Date | Status | Loan Amount | Loan Type |
|---|---|---|---|
| Open | $192,000 | New Conventional | |
| Previous Owner | $100,000 | Seller Take Back |
Source: Fresno MLS
MLS Number: 640392
APN: 407-720-08
Disclaimer: Certain information contained herein is derived from information provided by parties other than Homes.com. All information provided is deemed reliable, but is not guaranteed to be accurate and should be independently verified.
![]() IDX information is provided exclusively for personal, non-commercial use, and may not be used for any purpose other than to identify prospective properties consumers may be interested in purchasing. Information is deemed reliable but not guaranteed.
IDX information is provided exclusively for personal, non-commercial use, and may not be used for any purpose other than to identify prospective properties consumers may be interested in purchasing. Information is deemed reliable but not guaranteed.
- 6300 N Palm Ave Unit 105
- 6300 N Palm Ave Unit 125
- 6260 N Palm Ave Unit 111
- 665 W Escalon Ave
- 411 W Vartikian Ave
- 6337 N Palm Ave
- 1041 W Sierra Ave
- 6338 N Maroa Ave Unit 115
- 6164 N Maroa Ave
- 365 W Escalon Ave
- 355 W Sierra Ave Unit 106
- 1070 W Stuart Ave
- 1083 W Escalon Ave
- 317 W Sierra Ave Unit 124
- 317 W Sierra Ave Unit 107
- 573 W Fremont Ave
- 744 W Palo Altp Ave
- 1102 W Paul Ave
- 6607 N Maroa Ave
- 6316 N Poplar Ave
- 657 W Sierra Ave
- 475-585 W Sierra Ave
- 6462 N Remington Ave
- 107 E Sierra Ave
- 1237 W Spruce Ave Unit 1239
- 7095 N Fruit Ave
- 109 W Barstow Ave
- 512 W San Jose Ave
- 1538 W Herndon Ave
- 5090 N Roosevelt Ave Unit 35
- 6655 N Fresno St
- 6158 N Fresno St Unit 101
- 7135 N Fresno St
- 7047 N West Ave
- 373 W Nees Ave
- 5155 N Fresno St
- 481 W Audubon Dr
- 8070 N Poplar Ave
- 1050-1150 E Herndon Ave
- 7511 N 1st St
