Estimated Value: $343,000 - $356,553
3
Beds
2
Baths
1,032
Sq Ft
$339/Sq Ft
Est. Value
About This Home
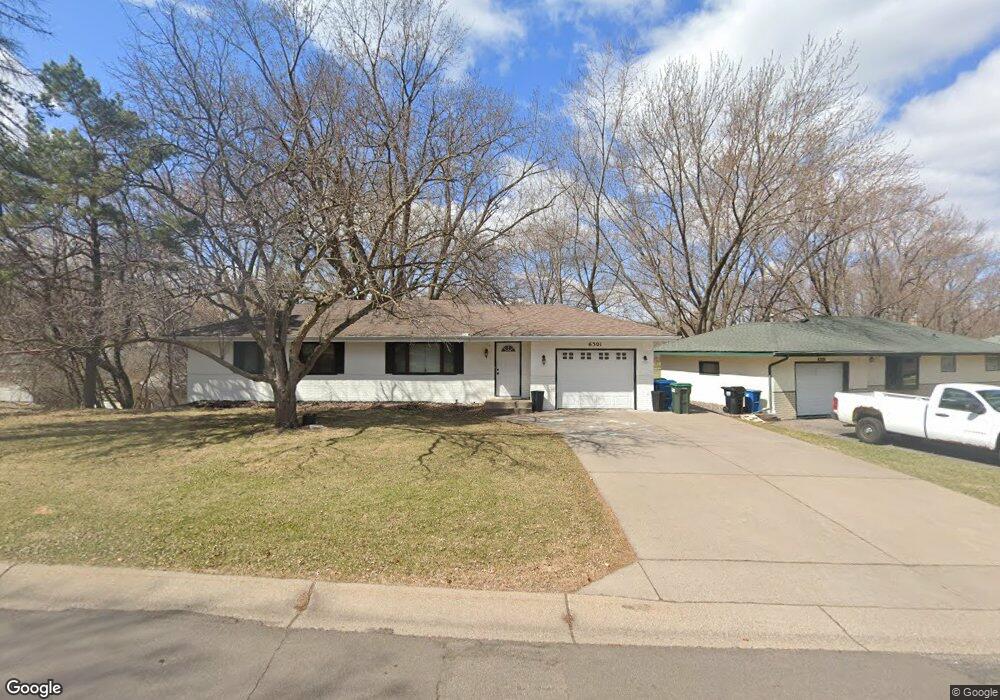
This home is located at 6301 Zinnia Ln N, Osseo, MN 55311 and is currently estimated at $349,638, approximately $338 per square foot. 6301 Zinnia Ln N is a home located in Hennepin County with nearby schools including Oak View Elementary School, Maple Grove Middle School, and Maple Grove Senior High School.
Ownership History
Date
Name
Owned For
Owner Type
Purchase Details
Closed on
Jul 16, 2020
Sold by
Willow Llc
Bought by
Dynan Kathleen A
Current Estimated Value
Home Financials for this Owner
Home Financials are based on the most recent Mortgage that was taken out on this home.
Original Mortgage
$281,300
Outstanding Balance
$249,901
Interest Rate
3.2%
Mortgage Type
New Conventional
Estimated Equity
$99,737
Purchase Details
Closed on
Mar 15, 2017
Sold by
Simonsen Mitchell Evan and Simonsen Deanna Maria
Bought by
Willow Llc
Purchase Details
Closed on
Dec 28, 2007
Sold by
Not Provided and Hansen Sally A
Bought by
Simonson Mitchell Evan and Simonson Deanna Maria
Home Financials for this Owner
Home Financials are based on the most recent Mortgage that was taken out on this home.
Original Mortgage
$211,850
Interest Rate
6.27%
Mortgage Type
New Conventional
Create a Home Valuation Report for This Property
The Home Valuation Report is an in-depth analysis detailing your home's value as well as a comparison with similar homes in the area
Home Values in the Area
Average Home Value in this Area
Purchase History
| Date | Buyer | Sale Price | Title Company |
|---|---|---|---|
| Dynan Kathleen A | $290,000 | Network Title Inc | |
| Willow Llc | $215,000 | None Available | |
| Simonson Mitchell Evan | $223,000 | -- |
Source: Public Records
Mortgage History
| Date | Status | Borrower | Loan Amount |
|---|---|---|---|
| Open | Dynan Kathleen A | $281,300 | |
| Previous Owner | Simonson Mitchell Evan | $211,850 |
Source: Public Records
Tax History Compared to Growth
Tax History
| Year | Tax Paid | Tax Assessment Tax Assessment Total Assessment is a certain percentage of the fair market value that is determined by local assessors to be the total taxable value of land and additions on the property. | Land | Improvement |
|---|---|---|---|---|
| 2024 | $3,908 | $334,500 | $115,300 | $219,200 |
| 2023 | $4,065 | $351,000 | $130,500 | $220,500 |
| 2022 | $3,258 | $347,100 | $117,600 | $229,500 |
| 2021 | $2,902 | $278,500 | $85,400 | $193,100 |
| 2020 | $3,129 | $247,300 | $57,400 | $189,900 |
| 2019 | $3,216 | $240,700 | $60,200 | $180,500 |
| 2018 | $2,838 | $233,500 | $66,200 | $167,300 |
| 2017 | $2,720 | $201,200 | $61,000 | $140,200 |
| 2016 | $2,586 | $190,400 | $53,000 | $137,400 |
| 2015 | $2,612 | $187,500 | $52,000 | $135,500 |
| 2014 | -- | $160,500 | $45,500 | $115,000 |
Source: Public Records
Map
Nearby Homes
- 13505 63rd Ave N
- 6412 Xenium Ln N
- 6245 Annapolis Ln N
- 13940 64th Ave N
- 6510 Glacier Ln N
- 6258 Fernbrook Ln N
- 6170 Dallas Ln N
- 13445 60th Place N Unit 94
- 5995 Wedgewood Ln N Unit 75
- 5955 Wedgewood Ln N Unit 71
- 5915 Yucca Ln N
- 6363 Juneau Ln N
- 6724 Timber Crest Dr
- 14190 Sunnyslope Dr
- 12083 Robin Rd
- 6386 Minnesota Ln N
- 6583 Lanewood Ln N
- 15088 65th Place N
- 5825 Rosewood Ln N
- 5640 Dallas Ln N
- 6305 Zinnia Ln N
- XXXXX 63rd Ave
- 13700 63rd Ave N
- 13742 63rd Ave N
- 6309 Zinnia Ln N
- 13680 63rd Ave N
- 6353 Zinnia Ln N
- 6312 Zinnia Ln N
- 13756 63rd Ave N
- 6322 Zinnia Ln N
- 6332 Zinnia Ln N
- 6342 Zinnia Ln N
- 13650 63rd Ave N
- 6367 Zinnia Ln N
- 13650 13650 63rd-Avenue-n
- 13800 63rd Ave N
- 6358 Zinnia Ln N
- 13693 63rd Ave N
- 13751 63rd Ave N
- 13683 63rd Ave N