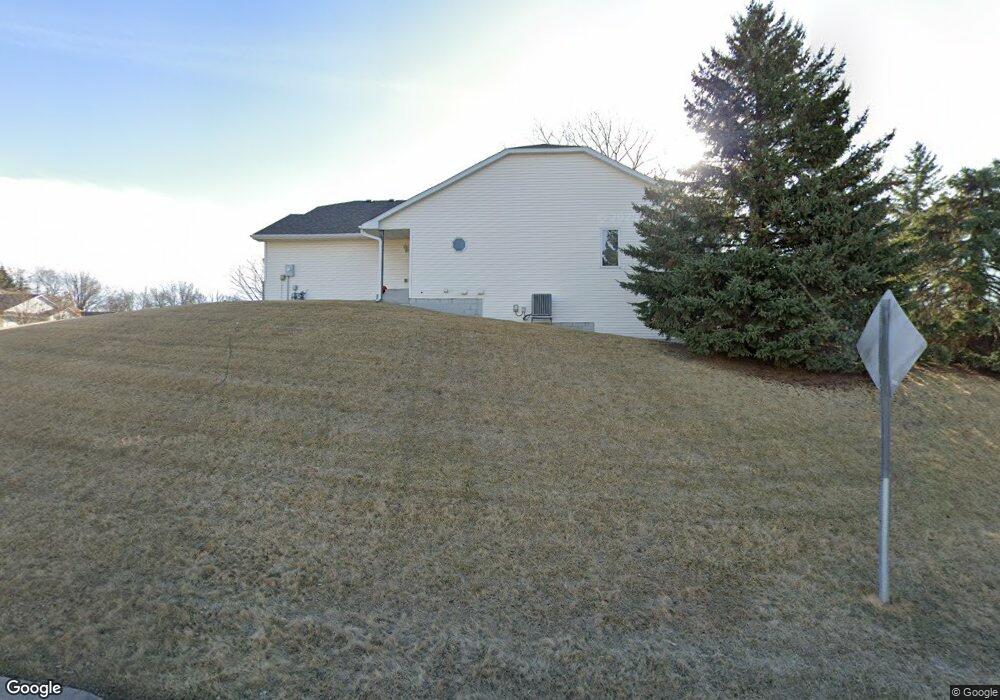
6302 Cavell Ct Brooklyn Park, MN 55428
Bass Creek NeighborhoodEstimated Value: $245,000 - $265,000
2
Beds
2
Baths
1,688
Sq Ft
$154/Sq Ft
Est. Value
About This Home
This home is located at 6302 Cavell Ct, Brooklyn Park, MN 55428 and is currently estimated at $259,352, approximately $153 per square foot. 6302 Cavell Ct is a home located in Hennepin County with nearby schools including Meadow Lake Elementary School, Robbinsdale Middle School, and Robbinsdale Cooper Senior High School.
Ownership History
Date
Name
Owned For
Owner Type
Purchase Details
Closed on
Feb 15, 2022
Sold by
Rogers-Austin Amy L and Rogers-Austin Bruce R
Bought by
Chakua Edith
Current Estimated Value
Home Financials for this Owner
Home Financials are based on the most recent Mortgage that was taken out on this home.
Original Mortgage
$251,750
Outstanding Balance
$233,769
Interest Rate
3.55%
Mortgage Type
New Conventional
Estimated Equity
$25,583
Purchase Details
Closed on
Jun 29, 2016
Sold by
Rogers Ester Venitta
Bought by
Rogers Austin Amy L and Austin Bruce R
Home Financials for this Owner
Home Financials are based on the most recent Mortgage that was taken out on this home.
Original Mortgage
$129,125
Interest Rate
3.64%
Mortgage Type
VA
Purchase Details
Closed on
Dec 23, 1997
Sold by
Prime Builders Inc
Bought by
Rogers Ester Venitta
Create a Home Valuation Report for This Property
The Home Valuation Report is an in-depth analysis detailing your home's value as well as a comparison with similar homes in the area
Home Values in the Area
Average Home Value in this Area
Purchase History
| Date | Buyer | Sale Price | Title Company |
|---|---|---|---|
| Chakua Edith | $265,000 | None Listed On Document | |
| Rogers Austin Amy L | $125,000 | Burnet Title | |
| Rogers Ester Venitta | $123,875 | -- |
Source: Public Records
Mortgage History
| Date | Status | Borrower | Loan Amount |
|---|---|---|---|
| Open | Chakua Edith | $251,750 | |
| Previous Owner | Rogers Austin Amy L | $129,125 |
Source: Public Records
Tax History Compared to Growth
Tax History
| Year | Tax Paid | Tax Assessment Tax Assessment Total Assessment is a certain percentage of the fair market value that is determined by local assessors to be the total taxable value of land and additions on the property. | Land | Improvement |
|---|---|---|---|---|
| 2024 | $3,127 | $236,200 | $65,000 | $171,200 |
| 2023 | $3,283 | $252,400 | $65,000 | $187,400 |
| 2022 | $2,879 | $251,400 | $65,000 | $186,400 |
| 2021 | $2,662 | $213,000 | $40,000 | $173,000 |
| 2020 | $2,738 | $199,500 | $40,000 | $159,500 |
| 2019 | $2,257 | $196,200 | $40,000 | $156,200 |
| 2018 | $2,251 | $159,000 | $27,000 | $132,000 |
| 2017 | $2,212 | $151,500 | $27,000 | $124,500 |
| 2016 | $2,009 | $134,700 | $27,000 | $107,700 |
| 2015 | $1,903 | $128,000 | $27,000 | $101,000 |
| 2014 | -- | $125,800 | $27,000 | $98,800 |
Source: Public Records
Map
Nearby Homes
- 6314 Cavell Ct
- 8717 63rd Ave N
- 6325 Decatur Ave N
- 6215 Cavell Ave N
- 9100 61st 1 2 Ave N
- Lot 016 63rd Ave N
- 8920 61st Ave N
- 6280 Sunrise Terrace
- 9132 66th Cir N
- 6224 Magda Dr Unit D
- 6242 Magda Dr Unit C
- 6308 Utah Ave N
- 6040 Xylon Ave N
- 6517 Kilmer Ln N
- 7916 61st Ave N
- 6140 Utah Ave N
- 5849 Boone Ave N
- 5900 Hillsboro Ave N
- 7850 61st Ave N
- 7720 61st Ave N
- 6304 Cavell Ct
- 6300 Cavell Ct
- 6306 Cavell Ct
- 6305 Cavell Ct
- 6303 Cavell Ct
- 6307 Cavell Ct
- 6301 Cavell Ct
- 6308 Cavell Ct
- 8748 Bass Creek Ave N
- 6311 Cavell Ct
- 6313 Cavell Ct
- 6309 Cavell Ct
- 6338 Cavell Ct
- 6310 Cavell Ct
- 6336 Cavell Ct
- 6340 Cavell Ct
- 6317 Cavell Ct
- 8740 Bass Creek Ave N
- 6319 Cavell Ct
- 6312 Cavell Ct