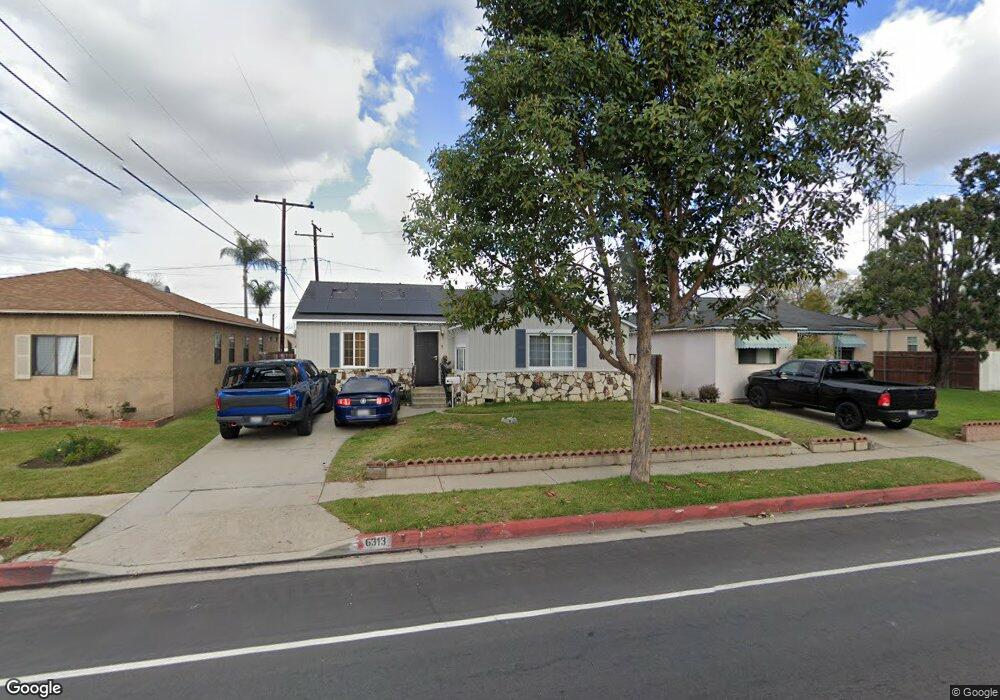
6307 Paramount Blvd Pico Rivera, CA 90660
Estimated Value: $702,696 - $749,000
2
Beds
1
Bath
1,144
Sq Ft
$635/Sq Ft
Est. Value
About This Home
This home is located at 6307 Paramount Blvd, Pico Rivera, CA 90660 and is currently estimated at $726,424, approximately $634 per square foot. 6307 Paramount Blvd is a home located in Los Angeles County with nearby schools including Rio Vista Elementary School, Ruben Salazar Continuation School, and El Rancho High School.
Ownership History
Date
Name
Owned For
Owner Type
Purchase Details
Closed on
Jan 22, 2004
Sold by
Contreras Carlos
Bought by
Contreras Carlos
Current Estimated Value
Home Financials for this Owner
Home Financials are based on the most recent Mortgage that was taken out on this home.
Original Mortgage
$170,000
Outstanding Balance
$79,061
Interest Rate
5.82%
Mortgage Type
New Conventional
Estimated Equity
$647,363
Purchase Details
Closed on
Sep 1, 1998
Sold by
Federal Home Loan Mortgage Corporation
Bought by
Contreras Carlos and Ceja Monica
Home Financials for this Owner
Home Financials are based on the most recent Mortgage that was taken out on this home.
Original Mortgage
$142,485
Interest Rate
6.93%
Mortgage Type
FHA
Purchase Details
Closed on
Jan 20, 1998
Sold by
Pardo Candelario and Federal Home Loan Mortgage Cor
Bought by
Federal Home Loan Mortgage Corporation
Create a Home Valuation Report for This Property
The Home Valuation Report is an in-depth analysis detailing your home's value as well as a comparison with similar homes in the area
Home Values in the Area
Average Home Value in this Area
Purchase History
| Date | Buyer | Sale Price | Title Company |
|---|---|---|---|
| Contreras Carlos | -- | First American Title Co | |
| Contreras Carlos | $145,000 | Stewart Title | |
| Federal Home Loan Mortgage Corporation | $128,000 | Chicago Title Co |
Source: Public Records
Mortgage History
| Date | Status | Borrower | Loan Amount |
|---|---|---|---|
| Open | Contreras Carlos | $170,000 | |
| Closed | Contreras Carlos | $142,485 |
Source: Public Records
Tax History
| Year | Tax Paid | Tax Assessment Tax Assessment Total Assessment is a certain percentage of the fair market value that is determined by local assessors to be the total taxable value of land and additions on the property. | Land | Improvement |
|---|---|---|---|---|
| 2025 | $4,714 | $316,238 | $217,496 | $98,742 |
| 2024 | $4,714 | $310,038 | $213,232 | $96,806 |
| 2023 | $4,586 | $303,959 | $209,051 | $94,908 |
| 2022 | $4,382 | $298,000 | $204,952 | $93,048 |
| 2021 | $4,268 | $292,158 | $200,934 | $91,224 |
| 2019 | $4,240 | $283,494 | $194,975 | $88,519 |
| 2018 | $4,013 | $277,936 | $191,152 | $86,784 |
| 2017 | $3,971 | $272,487 | $187,404 | $85,083 |
| 2016 | $3,628 | $267,145 | $183,730 | $83,415 |
| 2015 | $3,574 | $263,134 | $180,971 | $82,163 |
| 2014 | $3,532 | $257,981 | $177,427 | $80,554 |
Source: Public Records
Map
Nearby Homes
- 6449 Triton Dr
- 6722 Keltonview Dr
- 5259 Calico Ave
- 9243 Balfour St
- 5313 Manzanar Ave
- 405 S Bluff Rd
- 6651 Via Vista
- 6650 Via Vista
- 6630 Via Vista
- 6648 Via Vista
- 9324 Rosehedge Dr
- 9203 Loch Lomond Dr
- 649 S 5th St
- 524 Washington Blvd
- 915 Carob Way Unit 3
- 5101 Lindsey Ave
- 9514 Bradhurst St
- 932 S Montebello Blvd
- 7019 Passons Blvd
- 7021 Passons Blvd
- 6303 Paramount Blvd
- 6313 Paramount Blvd
- 6317 Paramount Blvd
- 6326 Silverette Dr
- 6338 Silverette Dr
- 6323 Paramount Blvd
- 6311 Maris Ave
- 6344 Silverette Dr
- 6308 Paramount Blvd
- 6312 Paramount Blvd
- 6302 Paramount Blvd
- 6329 Paramount Blvd
- 6318 Paramount Blvd
- 6303 Maris Ave
- 6350 Silverette Dr
- 6322 Paramount Blvd
- 6333 Paramount Blvd
- 6239 Maris Ave
- 6356 Silverette Dr
- 6328 Paramount Blvd
Your Personal Tour Guide
Ask me questions while you tour the home.