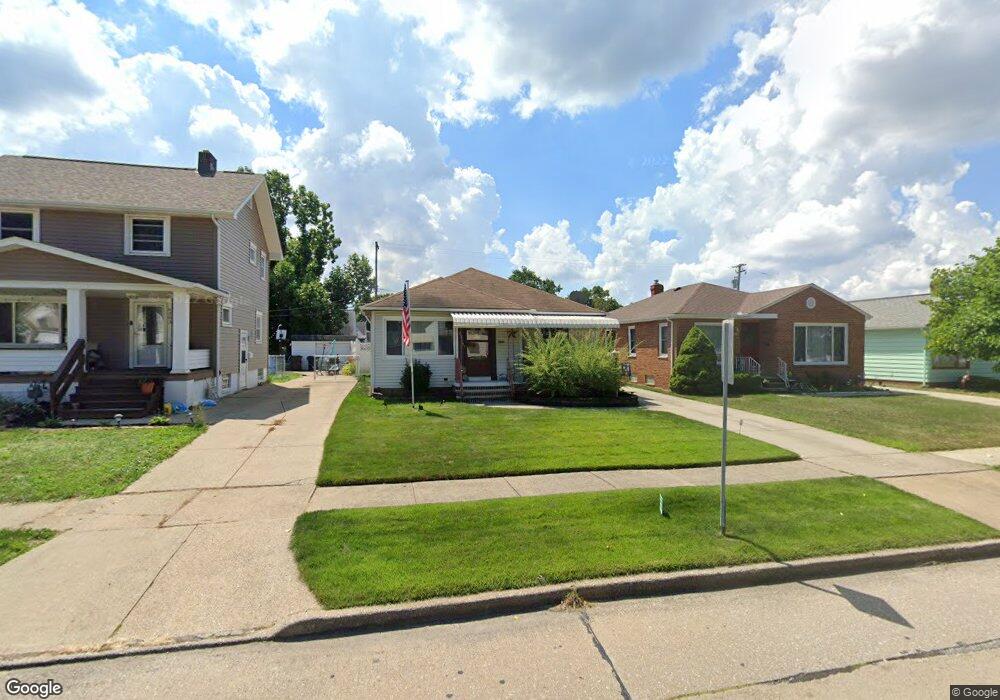
6307 Ridgewood Ave Cleveland, OH 44129
Estimated Value: $168,000 - $199,000
3
Beds
2
Baths
1,115
Sq Ft
$167/Sq Ft
Est. Value
About This Home
This home is located at 6307 Ridgewood Ave, Cleveland, OH 44129 and is currently estimated at $185,901, approximately $166 per square foot. 6307 Ridgewood Ave is a home located in Cuyahoga County with nearby schools including Thoreau Park Elementary School, Shiloh Middle School, and Parma High School.
Ownership History
Date
Name
Owned For
Owner Type
Purchase Details
Closed on
May 19, 2005
Sold by
Elias James E
Bought by
Borso Kenneth F and Borso Janet A
Current Estimated Value
Home Financials for this Owner
Home Financials are based on the most recent Mortgage that was taken out on this home.
Original Mortgage
$78,000
Outstanding Balance
$41,217
Interest Rate
6.05%
Mortgage Type
Fannie Mae Freddie Mac
Estimated Equity
$144,684
Purchase Details
Closed on
Mar 17, 1998
Sold by
Estate Of Donald Edwin Elias
Bought by
Elias Margaret K
Purchase Details
Closed on
Apr 21, 1993
Sold by
Stefanski Raymond A
Bought by
Elias Donald E
Purchase Details
Closed on
Apr 2, 1985
Sold by
Stefanski Raymond A
Bought by
Stefanski Raymond A
Purchase Details
Closed on
Jul 23, 1980
Sold by
Prebel Ernestine
Bought by
Stefanski Raymond A
Purchase Details
Closed on
Jan 1, 1975
Bought by
Prebel Ernestine
Create a Home Valuation Report for This Property
The Home Valuation Report is an in-depth analysis detailing your home's value as well as a comparison with similar homes in the area
Home Values in the Area
Average Home Value in this Area
Purchase History
| Date | Buyer | Sale Price | Title Company |
|---|---|---|---|
| Borso Kenneth F | $123,000 | Mutual Title | |
| Elias Margaret K | -- | -- | |
| Elias Donald E | -- | -- | |
| Stefanski Raymond A | -- | -- | |
| Stefanski Raymond A | $52,000 | -- | |
| Prebel Ernestine | -- | -- |
Source: Public Records
Mortgage History
| Date | Status | Borrower | Loan Amount |
|---|---|---|---|
| Open | Borso Kenneth F | $78,000 |
Source: Public Records
Tax History Compared to Growth
Tax History
| Year | Tax Paid | Tax Assessment Tax Assessment Total Assessment is a certain percentage of the fair market value that is determined by local assessors to be the total taxable value of land and additions on the property. | Land | Improvement |
|---|---|---|---|---|
| 2024 | $3,557 | $56,350 | $9,940 | $46,410 |
| 2023 | $3,139 | $44,280 | $8,190 | $36,090 |
| 2022 | $3,109 | $44,280 | $8,190 | $36,090 |
| 2021 | $3,198 | $44,280 | $8,190 | $36,090 |
| 2020 | $2,799 | $34,060 | $6,300 | $27,760 |
| 2019 | $2,681 | $97,300 | $18,000 | $79,300 |
| 2018 | $2,545 | $34,060 | $6,300 | $27,760 |
| 2017 | $2,557 | $30,070 | $5,250 | $24,820 |
| 2016 | $2,541 | $30,070 | $5,250 | $24,820 |
| 2015 | $2,433 | $30,070 | $5,250 | $24,820 |
| 2014 | $2,433 | $30,700 | $5,360 | $25,340 |
Source: Public Records
Map
Nearby Homes
- 5815 Westlake Ave
- 6011 Theota Ave
- 5914 Forest Ave
- 6215 Forest Ave
- 6306 Gilbert Ave
- 6606 Theota Ave
- 6711 Forest Ave
- 6903 Forest Ave
- 5618 Bradley Ave
- 6403 Kenneth Ave
- 6014 Laverne Ave
- 5212 Wood Ave
- 5810 Laverne Ave
- 6211 Luelda Ave
- 5000 Torrington Ave
- 6021 Snow Rd
- 5906 Velma Ave
- 5511 Velma Ave
- 6706 Alber Ave
- 7609 Wooster Pkwy
- 6303 Ridgewood Ave
- 6311 Ridgewood Ave
- 6215 Ridgewood Ave
- 6315 Ridgewood Ave
- 6211 Ridgewood Ave
- 6304 Westlake Ave
- 6403 Ridgewood Ave
- 6302 Westlake Ave
- 6306 Westlake Ave
- 6214 Westlake Ave
- 6314 Westlake Ave
- 6207 Ridgewood Ave
- 6407 Ridgewood Ave
- 6210 Westlake Ave
- 6402 Westlake Ave
- 6302 Ridgewood Ave
- 6310 Ridgewood Ave
- 6214 Ridgewood Ave
- 6314 Ridgewood Ave
- 6306 Ridgewood Ave