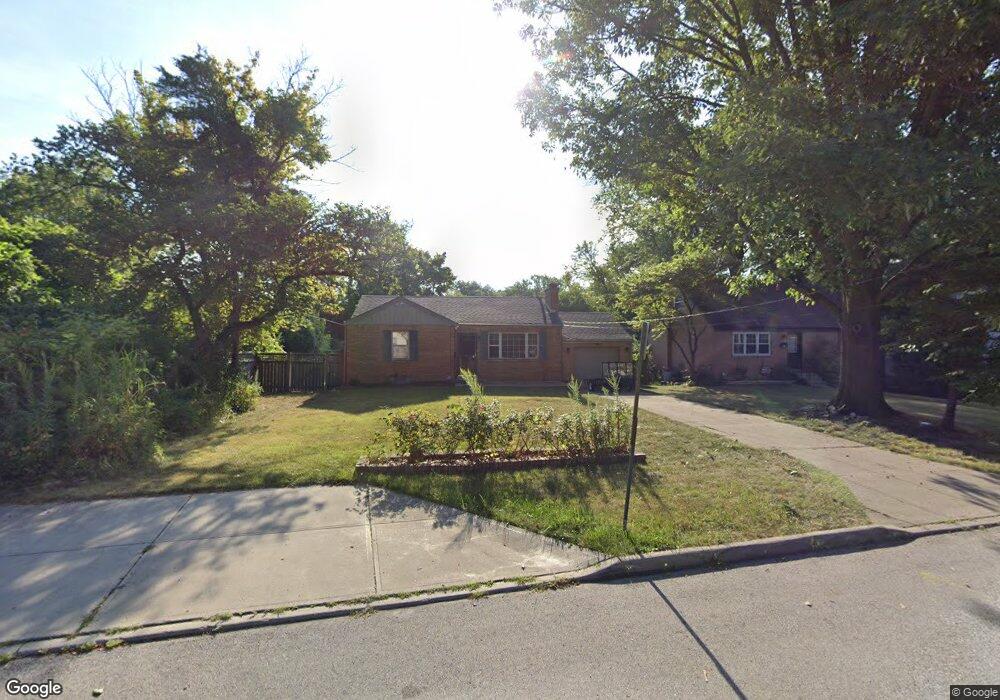
6308 Stella Ave Cincinnati, OH 45224
Finneytown NeighborhoodEstimated Value: $158,000 - $234,000
3
Beds
1
Bath
1,538
Sq Ft
$124/Sq Ft
Est. Value
About This Home
This home is located at 6308 Stella Ave, Cincinnati, OH 45224 and is currently estimated at $191,294, approximately $124 per square foot. 6308 Stella Ave is a home located in Hamilton County with nearby schools including Finneytown Elementary School, Finneytown Secondary Campus, and St. Vivian School.
Ownership History
Date
Name
Owned For
Owner Type
Purchase Details
Closed on
Sep 19, 2008
Sold by
Tri State Home Buyers Llc
Bought by
Sowers Brian
Current Estimated Value
Home Financials for this Owner
Home Financials are based on the most recent Mortgage that was taken out on this home.
Original Mortgage
$83,596
Outstanding Balance
$54,766
Interest Rate
6.55%
Mortgage Type
FHA
Estimated Equity
$136,528
Purchase Details
Closed on
Nov 9, 2007
Sold by
Jp Morgan Chase Bank Na
Bought by
Tri State Home Buyers Llc
Purchase Details
Closed on
Jul 10, 2007
Sold by
Napper Kabida and Krexmer John W
Bought by
Jp Morgan Chase Bank Na
Purchase Details
Closed on
Feb 7, 2003
Sold by
Kreimer John W and Kreimer Maureen
Bought by
Napper Kabida
Home Financials for this Owner
Home Financials are based on the most recent Mortgage that was taken out on this home.
Original Mortgage
$72,250
Interest Rate
10.99%
Purchase Details
Closed on
Jul 18, 2002
Sold by
Estate Of Lillian W Kreimer
Bought by
Kreimer John W
Create a Home Valuation Report for This Property
The Home Valuation Report is an in-depth analysis detailing your home's value as well as a comparison with similar homes in the area
Home Values in the Area
Average Home Value in this Area
Purchase History
| Date | Buyer | Sale Price | Title Company |
|---|---|---|---|
| Sowers Brian | $84,700 | Attorney | |
| Tri State Home Buyers Llc | $35,000 | Resource Title Agency Inc | |
| Jp Morgan Chase Bank Na | $56,000 | None Available | |
| Napper Kabida | $85,000 | Royal Land Title Agency Ltd | |
| Kreimer John W | -- | -- |
Source: Public Records
Mortgage History
| Date | Status | Borrower | Loan Amount |
|---|---|---|---|
| Open | Sowers Brian | $83,596 | |
| Previous Owner | Napper Kabida | $72,250 | |
| Closed | Napper Kabida | $8,500 |
Source: Public Records
Tax History
| Year | Tax Paid | Tax Assessment Tax Assessment Total Assessment is a certain percentage of the fair market value that is determined by local assessors to be the total taxable value of land and additions on the property. | Land | Improvement |
|---|---|---|---|---|
| 2025 | $2,964 | $42,382 | $10,234 | $32,148 |
| 2024 | $2,896 | $42,382 | $10,234 | $32,148 |
| 2023 | $2,847 | $42,382 | $10,234 | $32,148 |
| 2022 | $2,922 | $31,557 | $9,286 | $22,271 |
| 2021 | $2,867 | $31,557 | $9,286 | $22,271 |
| 2020 | $2,914 | $31,557 | $9,286 | $22,271 |
| 2019 | $2,675 | $26,740 | $7,868 | $18,872 |
| 2018 | $2,471 | $26,740 | $7,868 | $18,872 |
| 2017 | $2,355 | $26,740 | $7,868 | $18,872 |
| 2016 | $2,634 | $29,407 | $7,868 | $21,539 |
| 2015 | $2,650 | $29,407 | $7,868 | $21,539 |
| 2014 | $2,652 | $29,407 | $7,868 | $21,539 |
| 2013 | $2,700 | $30,954 | $8,281 | $22,673 |
Source: Public Records
Map
Nearby Homes
- 1148 Hollywood Ave
- 6538 S Oak Knoll Dr
- 6629 Charann Ln
- 1197 Toluca Ct
- 6101 Capri Dr
- 6145 Sunridge Dr
- 5940 Kenneth Ave
- 6071 Lantana Ave
- 6123 Kingsford Dr
- 6728 Sandalwood Ln
- 1140 Cedar Ave
- 6024 Sunridge Dr
- 6045 Tahiti Dr
- 6669 Kirkland Dr
- 6666 Orleans Ct
- 7873 Bobolink Dr
- 5974 Sunridge Dr
- 1552 Reid Ave
- 1565 Reid Ave
- 939 Venetian Terrace
- 6306 Stella Ave
- 6304 Stella Ave
- 6301 Marie Ave
- 6317 Stella Ave
- 6303 Marie Ave
- 6262 Stella Ave
- 6313 Stella Ave
- 6307 Stella Ave
- 6245 Marie Ave
- 6258 Stella Ave
- 6267 Stella Ave
- 6333 Stella Ave
- 6263 Stella Ave
- 6243 Marie Ave
- 6254 Stella Ave
- 6308 Marie Ave
- 6302 Marie Ave
- 6259 Stella Ave
- 6241 Marie Ave
- 6300 Marie Ave
Your Personal Tour Guide
Ask me questions while you tour the home.