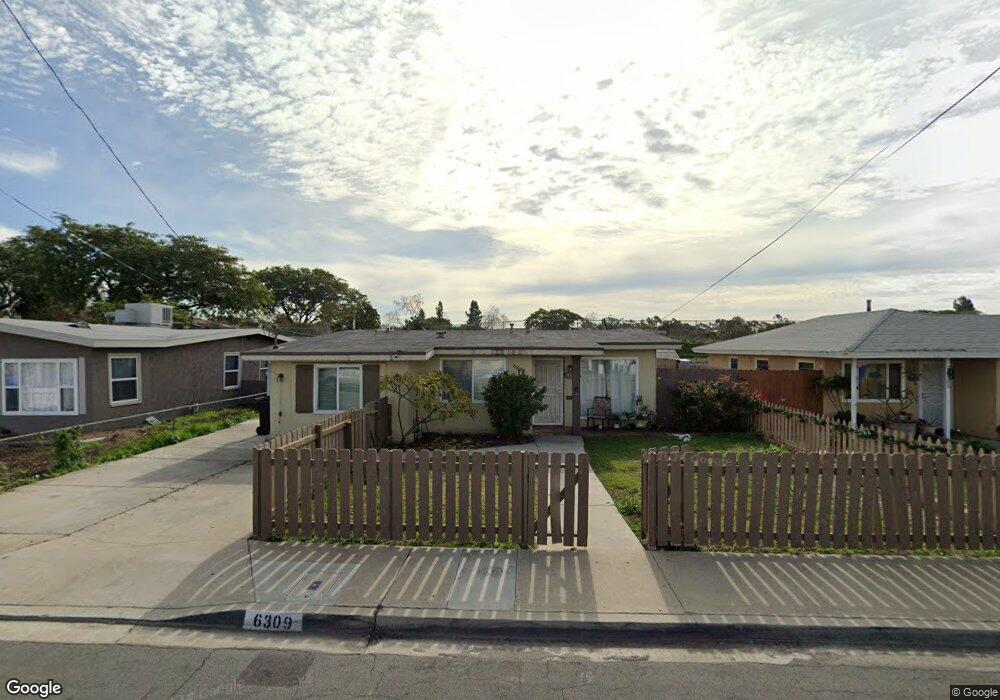
6309 Thorn St San Diego, CA 92115
Oak Park NeighborhoodEstimated Value: $754,000 - $795,000
4
Beds
2
Baths
1,490
Sq Ft
$522/Sq Ft
Est. Value
About This Home
This home is located at 6309 Thorn St, San Diego, CA 92115 and is currently estimated at $777,323, approximately $521 per square foot. 6309 Thorn St is a home located in San Diego County with nearby schools including Carver Elementary School, Mann Middle School, and Crawford High School.
Ownership History
Date
Name
Owned For
Owner Type
Purchase Details
Closed on
May 8, 2013
Sold by
Suvanto Erkka
Bought by
Morris Jonathan David and Morris Deborah
Current Estimated Value
Home Financials for this Owner
Home Financials are based on the most recent Mortgage that was taken out on this home.
Original Mortgage
$284,000
Outstanding Balance
$200,247
Interest Rate
3.37%
Mortgage Type
New Conventional
Estimated Equity
$577,076
Purchase Details
Closed on
Jan 15, 2013
Sold by
Suvanto Lotta I
Bought by
Suvanto Erkka J
Purchase Details
Closed on
Jan 7, 2013
Sold by
Allen Paul and Allen Ilce
Bought by
Suvanto Erkka J
Purchase Details
Closed on
Jun 7, 2004
Sold by
Reynolds Benjamin and Reynolds Rochelle M
Bought by
Allen Paul and Allen Ilce
Home Financials for this Owner
Home Financials are based on the most recent Mortgage that was taken out on this home.
Original Mortgage
$312,000
Interest Rate
5.5%
Mortgage Type
Purchase Money Mortgage
Purchase Details
Closed on
Nov 2, 1992
Purchase Details
Closed on
Dec 24, 1987
Create a Home Valuation Report for This Property
The Home Valuation Report is an in-depth analysis detailing your home's value as well as a comparison with similar homes in the area
Home Values in the Area
Average Home Value in this Area
Purchase History
| Date | Buyer | Sale Price | Title Company |
|---|---|---|---|
| Morris Jonathan David | $355,000 | Lawyers Title Company | |
| Suvanto Erkka J | -- | Lawyers Title | |
| Suvanto Erkka J | $230,000 | Lawyers Title | |
| Allen Paul | $390,000 | New Century Title Company | |
| -- | $139,900 | -- | |
| -- | $95,000 | -- |
Source: Public Records
Mortgage History
| Date | Status | Borrower | Loan Amount |
|---|---|---|---|
| Open | Morris Jonathan David | $284,000 | |
| Previous Owner | Allen Paul | $312,000 | |
| Closed | Allen Paul | $78,000 |
Source: Public Records
Tax History Compared to Growth
Tax History
| Year | Tax Paid | Tax Assessment Tax Assessment Total Assessment is a certain percentage of the fair market value that is determined by local assessors to be the total taxable value of land and additions on the property. | Land | Improvement |
|---|---|---|---|---|
| 2025 | $5,298 | $437,147 | $174,857 | $262,290 |
| 2024 | $5,298 | $428,577 | $171,429 | $257,148 |
| 2023 | $5,181 | $420,174 | $168,068 | $252,106 |
| 2022 | $5,043 | $411,936 | $164,773 | $247,163 |
| 2021 | $5,009 | $403,860 | $161,543 | $242,317 |
| 2020 | $4,949 | $399,720 | $159,887 | $239,833 |
| 2019 | $4,861 | $391,883 | $156,752 | $235,131 |
| 2018 | $4,463 | $384,200 | $153,679 | $230,521 |
| 2017 | $4,355 | $376,667 | $150,666 | $226,001 |
| 2016 | $4,284 | $369,282 | $147,712 | $221,570 |
| 2015 | $4,220 | $363,736 | $145,494 | $218,242 |
| 2014 | $4,152 | $356,611 | $142,644 | $213,967 |
Source: Public Records
Map
Nearby Homes
- 6310 Thorn St
- 6248 Thorn St
- 6212 Streamview Dr
- 6544 College Grove Dr Unit 68
- 6544 College Grove Dr Unit 71
- 6180 Kerch St
- 3428 Robin St
- 6333 College Grove Way Unit 11102
- 6333 College Grove Way Unit 13106
- 3861 Demus St
- 3675 Nassau Dr
- 3955 Faircross Place Unit 60
- 3955 Faircross Place Unit 78
- 5990 Dandridge Ln Unit 198
- 5985 Dandridge Ln Unit 103
- 5980 Dandridge Ln Unit 215
- 3980 Faircross Place Unit 32
- 3980 Faircross Place Unit 11
- 5763 Streamview Dr
- 3966 Vista Grande Dr