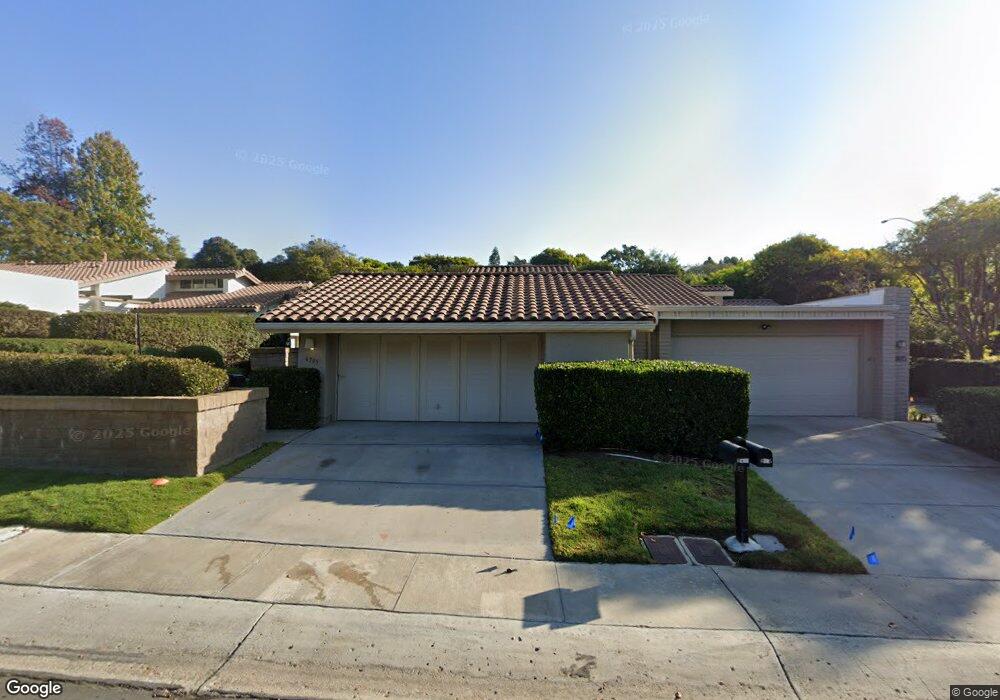
6309 Via Cabrera Unit LU127 La Jolla, CA 92037
La Jolla Alta NeighborhoodEstimated Value: $1,493,538 - $1,770,000
3
Beds
2
Baths
1,649
Sq Ft
$995/Sq Ft
Est. Value
About This Home
This home is located at 6309 Via Cabrera Unit LU127, La Jolla, CA 92037 and is currently estimated at $1,640,385, approximately $994 per square foot. 6309 Via Cabrera Unit LU127 is a home located in San Diego County with nearby schools including Bird Rock Elementary School, Muirlands Middle School, and La Jolla High School.
Ownership History
Date
Name
Owned For
Owner Type
Purchase Details
Closed on
Nov 21, 2025
Sold by
Carla Finn Trust and Finn Carla R
Bought by
6309 Via Cabrera Llc
Current Estimated Value
Purchase Details
Closed on
Nov 5, 2013
Sold by
Finn Carla R
Bought by
Finn Carla R
Purchase Details
Closed on
Aug 27, 2013
Sold by
Meads Richard W and Meads Betty Lou
Bought by
Finn Carla R
Purchase Details
Closed on
Aug 3, 2007
Sold by
Hedrick Karen Judith
Bought by
Meads Richard W and Meads Betty Lou
Home Financials for this Owner
Home Financials are based on the most recent Mortgage that was taken out on this home.
Original Mortgage
$325,000
Interest Rate
6.37%
Mortgage Type
Purchase Money Mortgage
Purchase Details
Closed on
Feb 22, 1995
Sold by
Cuthbertson Robert D and Cuthbertson Diane L
Bought by
Goodrich Manzer and Goodrich Florence G
Purchase Details
Closed on
Dec 19, 1984
Create a Home Valuation Report for This Property
The Home Valuation Report is an in-depth analysis detailing your home's value as well as a comparison with similar homes in the area
Home Values in the Area
Average Home Value in this Area
Purchase History
| Date | Buyer | Sale Price | Title Company |
|---|---|---|---|
| 6309 Via Cabrera Llc | -- | None Listed On Document | |
| Finn Carla R | -- | None Available | |
| Finn Carla R | $650,000 | Chicago Title Company | |
| Meads Richard W | $750,000 | Chicago Title Co | |
| Goodrich Manzer | $285,000 | Commonwealth Land Title | |
| -- | $210,000 | -- |
Source: Public Records
Mortgage History
| Date | Status | Borrower | Loan Amount |
|---|---|---|---|
| Previous Owner | Meads Richard W | $325,000 |
Source: Public Records
Tax History Compared to Growth
Tax History
| Year | Tax Paid | Tax Assessment Tax Assessment Total Assessment is a certain percentage of the fair market value that is determined by local assessors to be the total taxable value of land and additions on the property. | Land | Improvement |
|---|---|---|---|---|
| 2025 | $9,625 | $796,800 | $160,546 | $636,254 |
| 2024 | $9,625 | $781,178 | $157,399 | $623,779 |
| 2023 | $9,413 | $765,862 | $154,313 | $611,549 |
| 2022 | $9,163 | $750,846 | $151,288 | $599,558 |
| 2021 | $9,101 | $736,124 | $148,322 | $587,802 |
| 2020 | $8,991 | $728,577 | $146,802 | $581,775 |
| 2019 | $8,830 | $714,292 | $143,924 | $570,368 |
| 2018 | $8,256 | $700,287 | $141,102 | $559,185 |
| 2017 | $80 | $686,557 | $138,336 | $548,221 |
| 2016 | $7,932 | $673,096 | $135,624 | $537,472 |
| 2015 | $7,815 | $662,986 | $133,587 | $529,399 |
| 2014 | $7,692 | $650,000 | $130,971 | $519,029 |
Source: Public Records
Map
Nearby Homes
- 6389 Castejon Dr
- 6489 Caminito Catalan
- 2448 Sagebrush Ct
- 6121 La Pintura Dr
- 6099 La Jolla Scenic Dr S Unit 1774
- 5826 Soledad Mountain Rd
- 5979 Via Zurita
- 6887 Avenida Andorra
- 6815 La Jolla Scenic Dr S
- 6005 La Jolla Scenic Dr S
- 2871 Caminito Merion
- 5777 Desert View Dr
- 2173 Caminito San Martin
- 2047 Caminito Circulo Norte
- 1619 Calle de Primra
- 2082 Via Casa Alta
- 2163 Caminito Circulo Norte Unit 126
- 2003 Caminito Circulo Norte
- 1640 El Paso Real
- 1733 Nautilus St
- 6315 Via Cabrera
- 6325 Via Cabrera
- 6329 Via Cabrera
- 2209 Via Tabara
- 2275 Via Tabara
- 2265 Via Tabara
- 2289 Via Tabara Unit LU129
- 2245 Via Tabara
- 2255 Via Tabara
- 2279 Via Tabara
- 2269 Via Tabara
- 2285 Via Tabara
- 2259 Via Tabara
- 2249 Via Tabara
- 2263 Via Pravia
- 2243 Via Pravia Unit LU170A
- 6305 Via Cabrera
- 2247 Via Pravia
- 2223 Via Pravia
- 6319 Via Cabrera