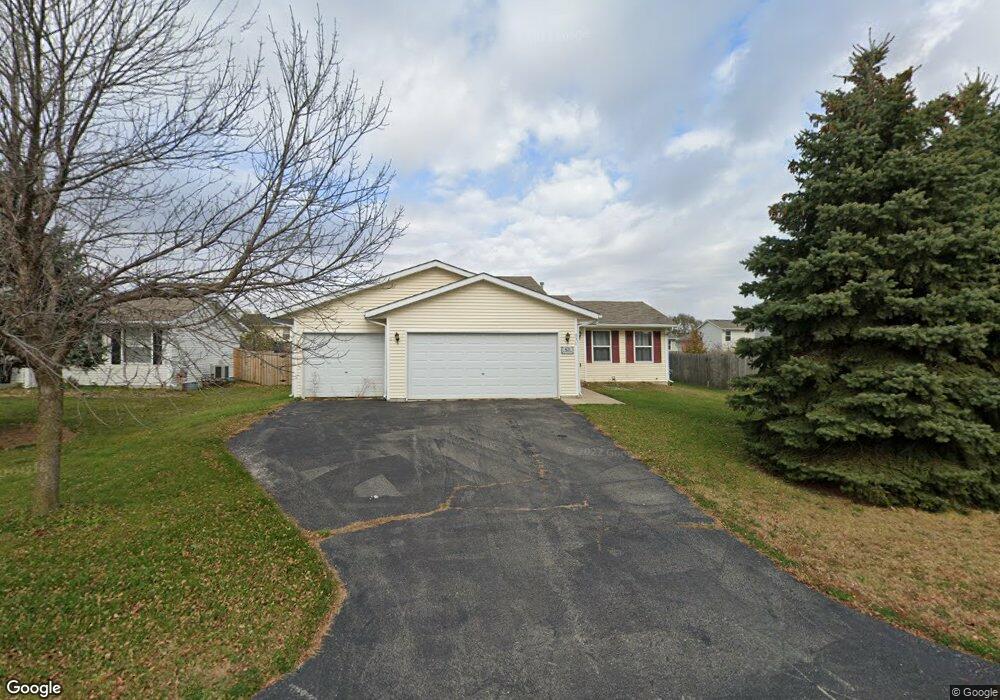
631 Cassandra Way South Beloit, IL 61080
Estimated Value: $178,000 - $219,000
2
Beds
1
Bath
984
Sq Ft
$209/Sq Ft
Est. Value
About This Home
This home is located at 631 Cassandra Way, South Beloit, IL 61080 and is currently estimated at $205,458, approximately $208 per square foot. 631 Cassandra Way is a home located in Winnebago County with nearby schools including Rockton Elementary School, Whitman Post Elementary School, and Stephen Mack Middle School.
Ownership History
Date
Name
Owned For
Owner Type
Purchase Details
Closed on
Mar 8, 2024
Sold by
Middlebury Apartments Llc
Bought by
Maggio Mary Ann
Current Estimated Value
Home Financials for this Owner
Home Financials are based on the most recent Mortgage that was taken out on this home.
Original Mortgage
$10,000
Interest Rate
6.63%
Mortgage Type
New Conventional
Purchase Details
Closed on
Mar 9, 2023
Sold by
Pennymac Loan Services Llc
Bought by
Middlebury Apartments Llc
Purchase Details
Closed on
Dec 23, 2022
Sold by
Judicial Sales Corporation
Bought by
Pennymac Loan Services Llc
Purchase Details
Closed on
Oct 12, 2018
Sold by
Petry 1989 Trust No
Bought by
Delehanty Michael J
Home Financials for this Owner
Home Financials are based on the most recent Mortgage that was taken out on this home.
Original Mortgage
$124,208
Interest Rate
4.5%
Mortgage Type
FHA
Create a Home Valuation Report for This Property
The Home Valuation Report is an in-depth analysis detailing your home's value as well as a comparison with similar homes in the area
Home Values in the Area
Average Home Value in this Area
Purchase History
| Date | Buyer | Sale Price | Title Company |
|---|---|---|---|
| Maggio Mary Ann | $95,000 | None Listed On Document | |
| Middlebury Apartments Llc | $140,000 | Mortgage Connect Lp | |
| Pennymac Loan Services Llc | -- | -- | |
| Delehanty Michael J | $126,500 | Security First Title | |
| Delehanty Michael J | $126,500 | Security First Title | |
| Delehanty Michael J | $126,500 | Security First Title |
Source: Public Records
Mortgage History
| Date | Status | Borrower | Loan Amount |
|---|---|---|---|
| Closed | Maggio Mary Ann | $10,000 | |
| Open | Maggio Mary Ann | $161,000 | |
| Previous Owner | Delehanty Michael J | $124,208 |
Source: Public Records
Tax History Compared to Growth
Tax History
| Year | Tax Paid | Tax Assessment Tax Assessment Total Assessment is a certain percentage of the fair market value that is determined by local assessors to be the total taxable value of land and additions on the property. | Land | Improvement |
|---|---|---|---|---|
| 2024 | $4,396 | $56,323 | $12,297 | $44,026 |
| 2023 | $4,245 | $50,221 | $10,965 | $39,256 |
| 2022 | $4,064 | $45,880 | $10,017 | $35,863 |
| 2021 | $3,884 | $42,935 | $9,374 | $33,561 |
| 2020 | $3,840 | $41,571 | $9,076 | $32,495 |
| 2019 | $3,791 | $40,045 | $8,743 | $31,302 |
| 2018 | $2,799 | $36,049 | $8,388 | $27,661 |
| 2017 | $2,850 | $34,553 | $8,040 | $26,513 |
| 2016 | $2,694 | $33,420 | $7,776 | $25,644 |
| 2015 | $2,659 | $32,656 | $7,598 | $25,058 |
| 2014 | $2,600 | $32,656 | $7,598 | $25,058 |
Source: Public Records
Map
Nearby Homes
- 14110 Kirane Ct
- 558 Moloney Dr
- 13840 de La Tour Dr
- 0000-03 Nautical Ct
- 0000-04 Nautical Ct
- 13714 Dorr Rd
- 1918 Oak Leaf Dr
- 14159 Talcott Dr
- 14854 Liston Ave
- 1996 Broadmoor Rd
- 428 E Chapel St
- 702 Washington St
- 614 Bayfield Rd
- 354 Fair Oaks Blvd
- 549 Bayfield Rd
- 15361 S Bluff Rd
- 14737 Manor Dr
- 4564 E Rockton Rd
- 1526 Fern Ln
- 1523 Fern Ln
- 627 Cassandra Way
- 635 Cassandra Way
- 630 Mose Way
- 623 Cassandra Way
- 639 Cassandra Way
- 626 Mose Way
- 634 Mose Way
- 630 Cassandra Way
- 622 Mose Way
- 638 Mose Way
- 626 Cassandra Way
- 643 Cassandra Way
- 622 Cassandra Way
- 14110 Windy Trail
- 638 Cassandra Way
- 14118 Windy Trail
- 642 Mose Way
- 14126 Windy Trail
- 647 Cassandra Way
- 649 Cassandra Way