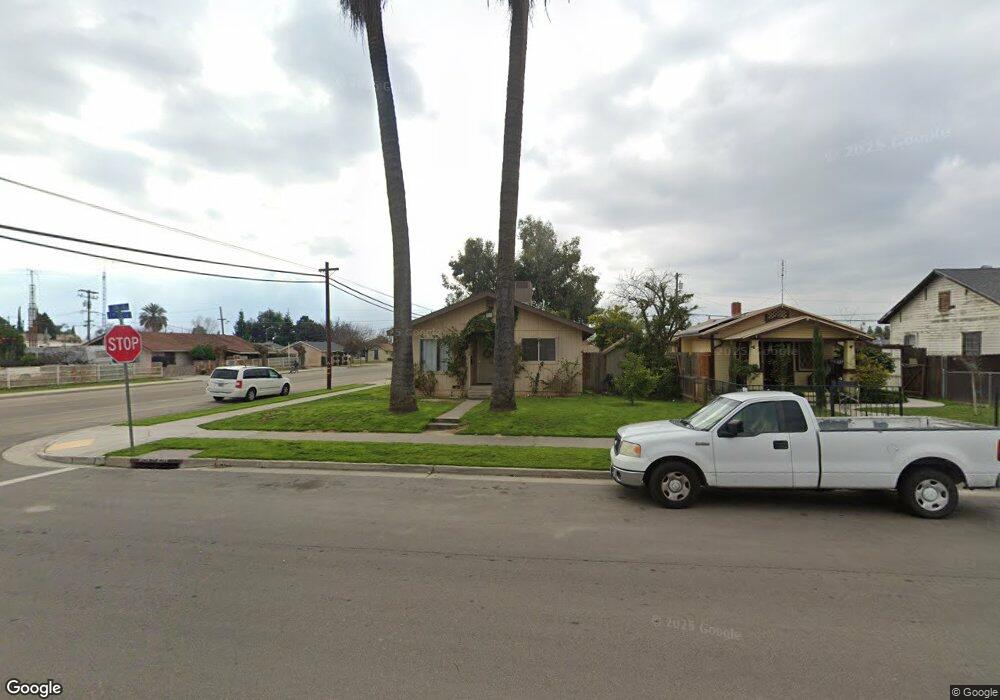
631 I St Sanger, CA 93657
Estimated Value: $264,000 - $321,000
3
Beds
1
Bath
1,248
Sq Ft
$234/Sq Ft
Est. Value
About This Home
This home is located at 631 I St, Sanger, CA 93657 and is currently estimated at $292,081, approximately $234 per square foot. 631 I St is a home located in Fresno County with nearby schools including Wilson Elementary School, Washington Academic Middle School, and Sanger High School.
Ownership History
Date
Name
Owned For
Owner Type
Purchase Details
Closed on
Mar 23, 2005
Sold by
Gonzalez Bonifacio H
Bought by
Bueno Bertha Lidia
Current Estimated Value
Purchase Details
Closed on
Jan 14, 2005
Sold by
Gilbert Larry A
Bought by
Bueno Bertha Lidia
Home Financials for this Owner
Home Financials are based on the most recent Mortgage that was taken out on this home.
Original Mortgage
$170,952
Interest Rate
8.85%
Mortgage Type
Purchase Money Mortgage
Purchase Details
Closed on
Oct 21, 2004
Sold by
Gilbert Alvin A
Bought by
Gilbert Larry A
Create a Home Valuation Report for This Property
The Home Valuation Report is an in-depth analysis detailing your home's value as well as a comparison with similar homes in the area
Home Values in the Area
Average Home Value in this Area
Purchase History
| Date | Buyer | Sale Price | Title Company |
|---|---|---|---|
| Bueno Bertha Lidia | -- | Stewart Title Of Fresno Cnty | |
| Bueno Bertha Lidia | $180,000 | Stewart Title Of Fresno Cnty | |
| Gilbert Larry A | -- | -- |
Source: Public Records
Mortgage History
| Date | Status | Borrower | Loan Amount |
|---|---|---|---|
| Previous Owner | Bueno Bertha Lidia | $170,952 | |
| Closed | Bueno Bertha Lidia | $8,997 |
Source: Public Records
Tax History
| Year | Tax Paid | Tax Assessment Tax Assessment Total Assessment is a certain percentage of the fair market value that is determined by local assessors to be the total taxable value of land and additions on the property. | Land | Improvement |
|---|---|---|---|---|
| 2025 | $3,363 | $250,186 | $62,717 | $187,469 |
| 2023 | $2,551 | $203,800 | $52,000 | $151,800 |
| 2022 | $2,440 | $196,000 | $50,000 | $146,000 |
| 2021 | $2,027 | $160,500 | $37,400 | $123,100 |
| 2020 | $1,969 | $159,000 | $37,100 | $121,900 |
| 2019 | $1,931 | $156,000 | $36,400 | $119,600 |
| 2018 | $1,852 | $153,000 | $35,700 | $117,300 |
| 2017 | $1,821 | $150,000 | $35,000 | $115,000 |
| 2016 | $1,631 | $140,000 | $30,000 | $110,000 |
| 2015 | $1,573 | $131,800 | $33,000 | $98,800 |
| 2014 | $1,484 | $123,500 | $30,900 | $92,600 |
Source: Public Records
Map
Nearby Homes
Your Personal Tour Guide
Ask me questions while you tour the home.