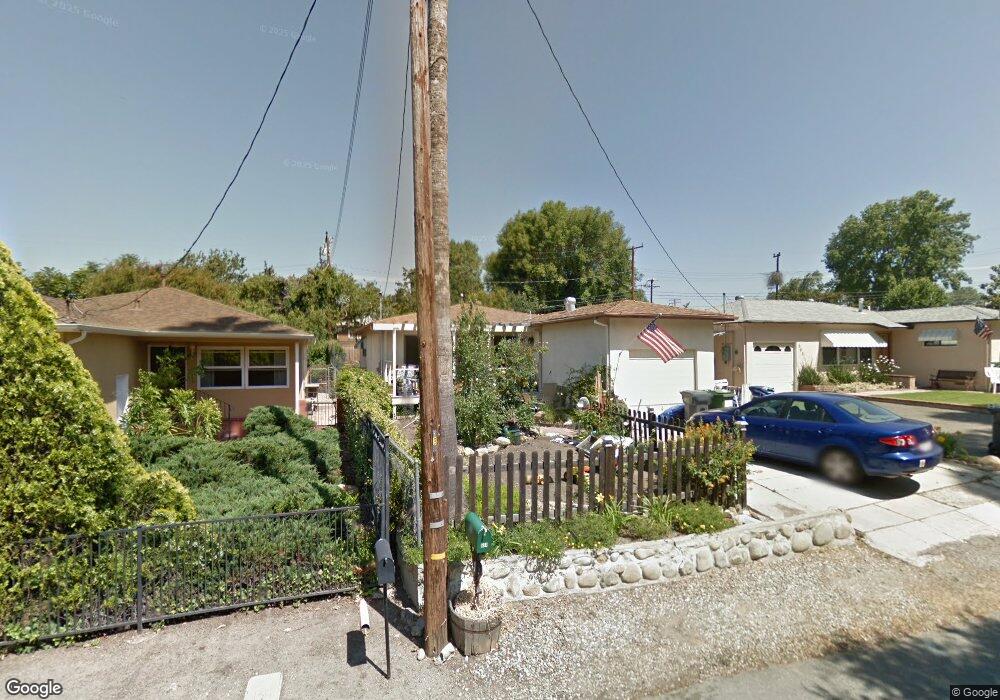
631 Irving Dr Thousand Oaks, CA 91360
Estimated Value: $631,375 - $848,000
2
Beds
1
Bath
924
Sq Ft
$789/Sq Ft
Est. Value
About This Home
This home is located at 631 Irving Dr, Thousand Oaks, CA 91360 and is currently estimated at $728,594, approximately $788 per square foot. 631 Irving Dr is a home located in Ventura County with nearby schools including Glenwood Elementary School, Colina Middle School, and Westlake High School.
Ownership History
Date
Name
Owned For
Owner Type
Purchase Details
Closed on
Nov 9, 2007
Sold by
Coon Matthew Reid
Bought by
Coon David George and Reid Louise Elizabeth
Current Estimated Value
Home Financials for this Owner
Home Financials are based on the most recent Mortgage that was taken out on this home.
Original Mortgage
$265,000
Outstanding Balance
$166,627
Interest Rate
6.26%
Mortgage Type
Purchase Money Mortgage
Estimated Equity
$561,967
Purchase Details
Closed on
Jun 21, 2001
Sold by
Schreiner Gary L
Bought by
Coon David George and Reid Louise Elizabeth
Home Financials for this Owner
Home Financials are based on the most recent Mortgage that was taken out on this home.
Original Mortgage
$156,750
Interest Rate
7.26%
Purchase Details
Closed on
Jul 11, 2000
Sold by
Stenzel Molly M
Bought by
Stenzel Molly M
Create a Home Valuation Report for This Property
The Home Valuation Report is an in-depth analysis detailing your home's value as well as a comparison with similar homes in the area
Purchase History
| Date | Buyer | Sale Price | Title Company |
|---|---|---|---|
| Coon David George | $88,500 | Stewart Title | |
| Coon David George | $165,000 | Fidelity National Title | |
| Stenzel Molly M | -- | -- |
Source: Public Records
Mortgage History
| Date | Status | Borrower | Loan Amount |
|---|---|---|---|
| Open | Coon David George | $265,000 | |
| Previous Owner | Coon David George | $156,750 | |
| Closed | Coon David George | $8,250 |
Source: Public Records
Tax History
| Year | Tax Paid | Tax Assessment Tax Assessment Total Assessment is a certain percentage of the fair market value that is determined by local assessors to be the total taxable value of land and additions on the property. | Land | Improvement |
|---|---|---|---|---|
| 2025 | $3,015 | $243,725 | $177,263 | $66,462 |
| 2024 | $3,015 | $238,947 | $173,788 | $65,159 |
| 2023 | $2,908 | $234,262 | $170,380 | $63,882 |
| 2022 | $2,855 | $229,669 | $167,039 | $62,630 |
| 2021 | $2,804 | $225,166 | $163,764 | $61,402 |
| 2020 | $2,413 | $222,859 | $162,086 | $60,773 |
| 2019 | $2,350 | $218,490 | $158,908 | $59,582 |
| 2018 | $2,303 | $214,207 | $155,793 | $58,414 |
| 2017 | $2,259 | $210,008 | $152,739 | $57,269 |
| 2016 | $2,238 | $205,892 | $149,745 | $56,147 |
| 2015 | $2,200 | $202,801 | $147,497 | $55,304 |
| 2014 | $2,169 | $198,830 | $144,608 | $54,222 |
Source: Public Records
Map
Nearby Homes
- 237 Houston Dr
- 714 Brossard Dr
- 83 Jensen Ct
- 531 Benson Way
- 764 Brossard Dr
- 441 Houston Dr
- 458 Houston Dr
- 515 Houston Dr
- 685 Paige Ln
- 0 Rimrock Unit SR25274785
- 860 Yorkshire Ave
- 1154 La Jolla Dr
- 1342 E Hillcrest Dr Unit 17
- 1350 E Hillcrest Dr
- 1346 E Hillcrest Dr Unit 49
- 146 Maegan Place Unit 9
- 104 Maegan Place Unit 12
- 104 Maegan Place Unit 6
- 110 Maegan Place Unit 13
- 1016 Saxon Place
- 603 Irving Dr
- 605 Irving Dr
- 601 Irving Dr
- 647 Irving Dr
- 196 Flittner Cir
- 200 Flittner Cir
- 192 Flittner Cir
- 599 Irving Dr
- 653 Irving Dr
- 188 Flittner Cir
- 204 Flittner Cir
- 597 Irving Dr
- 665 Irving Dr
- 643 Greenwich Dr
- 620 E Hillcrest Dr
- 184 Flittner Cir
- 602 E Hillcrest Dr
- 636 E Hillcrest Dr
- 583 Irving Dr
- 677 Irving Dr
Your Personal Tour Guide
Ask me questions while you tour the home.