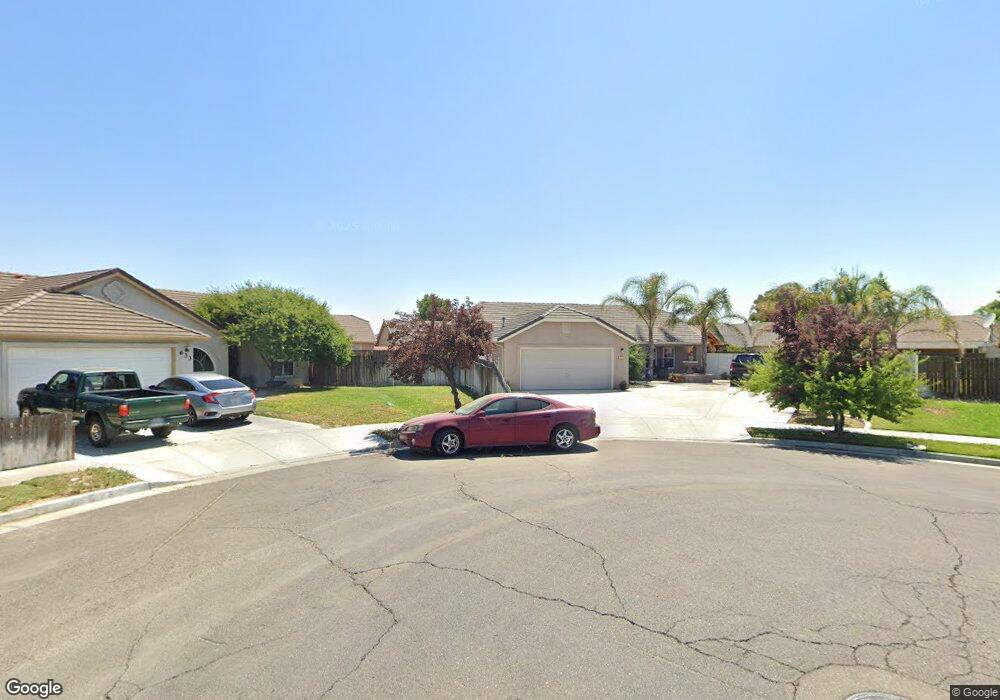
631 Langley Ct Los Banos, CA 93635
Estimated Value: $331,000 - $476,000
4
Beds
2
Baths
1,732
Sq Ft
$239/Sq Ft
Est. Value
About This Home
This home is located at 631 Langley Ct, Los Banos, CA 93635 and is currently estimated at $413,308, approximately $238 per square foot. 631 Langley Ct is a home located in Merced County with nearby schools including R.M. Miano Elementary School, Los Banos Junior High School, and Pacheco High School.
Ownership History
Date
Name
Owned For
Owner Type
Purchase Details
Closed on
Sep 12, 2011
Sold by
Bank Of America Na
Bought by
Rodriguez Claudia
Current Estimated Value
Home Financials for this Owner
Home Financials are based on the most recent Mortgage that was taken out on this home.
Original Mortgage
$120,796
Outstanding Balance
$82,046
Interest Rate
4.09%
Mortgage Type
FHA
Estimated Equity
$331,263
Purchase Details
Closed on
Jun 9, 2011
Sold by
Marquez Jorge
Bought by
Bac Home Loans Servicing Lp
Purchase Details
Closed on
May 8, 2006
Sold by
Regency Park Estates 1-4 Llc
Bought by
Marquez Jorge
Home Financials for this Owner
Home Financials are based on the most recent Mortgage that was taken out on this home.
Original Mortgage
$389,242
Interest Rate
8.25%
Mortgage Type
Negative Amortization
Create a Home Valuation Report for This Property
The Home Valuation Report is an in-depth analysis detailing your home's value as well as a comparison with similar homes in the area
Home Values in the Area
Average Home Value in this Area
Purchase History
| Date | Buyer | Sale Price | Title Company |
|---|---|---|---|
| Rodriguez Claudia | $130,000 | Transcounty Title Company | |
| Bac Home Loans Servicing Lp | $118,750 | First American Title Co | |
| Marquez Jorge | $410,000 | Fidelity Natl Title Co Of Ca |
Source: Public Records
Mortgage History
| Date | Status | Borrower | Loan Amount |
|---|---|---|---|
| Open | Rodriguez Claudia | $120,796 | |
| Previous Owner | Marquez Jorge | $389,242 |
Source: Public Records
Tax History Compared to Growth
Tax History
| Year | Tax Paid | Tax Assessment Tax Assessment Total Assessment is a certain percentage of the fair market value that is determined by local assessors to be the total taxable value of land and additions on the property. | Land | Improvement |
|---|---|---|---|---|
| 2025 | $2,698 | $163,274 | $16,322 | $146,952 |
| 2024 | $2,698 | $160,073 | $16,002 | $144,071 |
| 2023 | $2,550 | $156,936 | $15,689 | $141,247 |
| 2022 | $2,481 | $153,860 | $15,382 | $138,478 |
| 2021 | $2,417 | $150,844 | $15,081 | $135,763 |
| 2020 | $2,362 | $149,298 | $14,927 | $134,371 |
| 2019 | $2,309 | $146,372 | $14,635 | $131,737 |
| 2018 | $2,236 | $143,503 | $14,349 | $129,154 |
| 2017 | $2,179 | $140,690 | $14,068 | $126,622 |
| 2016 | $2,162 | $137,933 | $13,793 | $124,140 |
| 2015 | $2,098 | $135,862 | $13,586 | $122,276 |
| 2014 | $2,027 | $133,201 | $13,320 | $119,881 |
Source: Public Records
Map
Nearby Homes
- 1537 Cardinal St
- 510 Stonehaven Dr
- 1364 Dove St
- 1347 Dove St
- 766 Meadowlark Ave
- 2054 Casey Ln
- 814 Del Rio Dr
- 1406 Quail St
- 448 Barrett Ln
- 1349 Quail St
- 436 N Mercey Springs Rd Unit 69
- 436 N Mercey Springs Rd Unit 16
- 436 N Mercey Springs Rd Unit 93
- 436 N Mercey Springs Rd Unit 154
- 432 Barrett Ln
- 1416 San Rafael St
- 543 N Mercey Springs Rd
- 850 El Monte Ct
- 1338 Quail St
- Residence 3 Plan at Southpointe - Sierra Heights
- 627 Langley Ct
- 633 Langley Ct
- 658 Kensington Cir
- 642 Kensington Cir
- 646 Kensington Cir
- 664 Kensington Cir
- 638 Kensington Cir
- 650 Kensington Cir
- 623 Langley Ct
- 632 Langley Ct
- 634 Kensington Cir
- 670 Kensington Cir
- 626 Langley Ct
- 624 Langley Ct
- 1525 Cardinal St
- 1521 Cardinal St
- 1517 Cardinal St
- 645 Kensington Cir
- 665 Kensington Cir
- 679 Kensington Cir