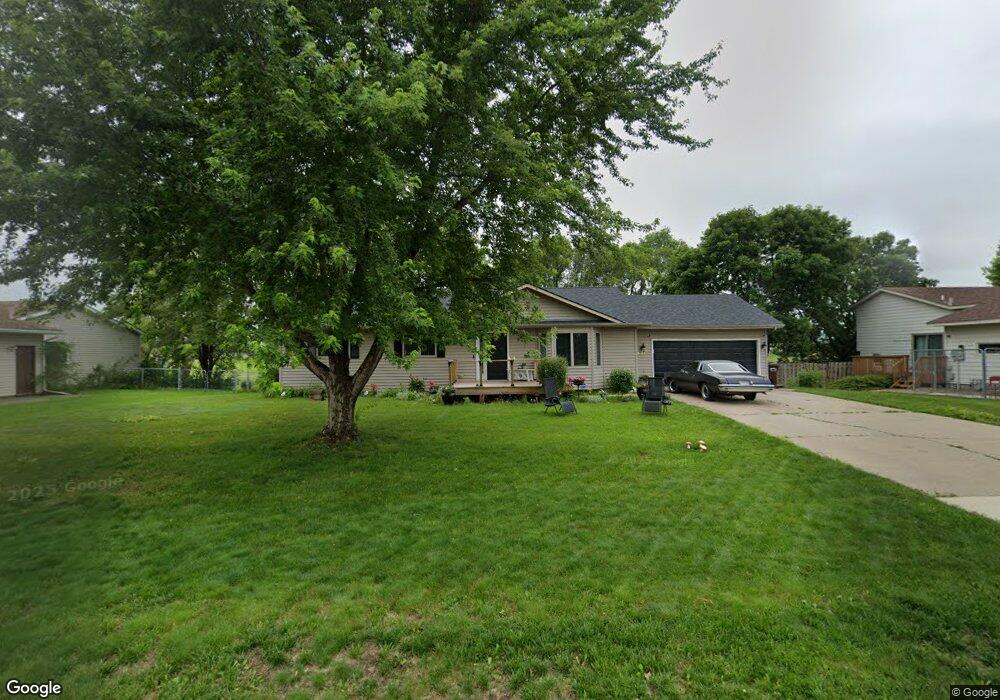
631 Robert Ave N Maple Lake, MN 55358
Estimated Value: $339,000 - $376,000
5
Beds
3
Baths
1,534
Sq Ft
$229/Sq Ft
Est. Value
About This Home
This home is located at 631 Robert Ave N, Maple Lake, MN 55358 and is currently estimated at $351,413, approximately $229 per square foot. 631 Robert Ave N is a home located in Wright County with nearby schools including Maple Lake Elementary School, Maple Lake High School, and St. Timothy's Parish School.
Ownership History
Date
Name
Owned For
Owner Type
Purchase Details
Closed on
Jun 16, 2020
Sold by
Glenwood Financial Llc
Bought by
Harvey Joseph L
Current Estimated Value
Home Financials for this Owner
Home Financials are based on the most recent Mortgage that was taken out on this home.
Original Mortgage
$250,381
Outstanding Balance
$221,944
Interest Rate
3.2%
Mortgage Type
FHA
Estimated Equity
$129,469
Purchase Details
Closed on
Dec 13, 2019
Sold by
Roehike Shawn and Roehike Rebecca
Bought by
Nje Holdings Llc
Purchase Details
Closed on
Sep 6, 2019
Sold by
Wells Fargo Bank National Association
Bought by
Wilmington Savings Fund Society Fsb and Residential Credit Opportunities Tr V D
Purchase Details
Closed on
Sep 26, 2006
Sold by
Ramos Kathleen J
Bought by
Roehlke Shawn and Roehlke Rebecca
Purchase Details
Closed on
Jan 30, 2003
Sold by
Brustuen Michael T and Brustuen Nichole J
Bought by
Ramos Kathleen J
Purchase Details
Closed on
May 29, 1998
Sold by
Nederquist Kevin J
Bought by
Brustuen Michael T and Brustuen Nicole J
Purchase Details
Closed on
Aug 8, 1997
Sold by
Judes North Addition Properties
Bought by
Chederquist Kevin J
Create a Home Valuation Report for This Property
The Home Valuation Report is an in-depth analysis detailing your home's value as well as a comparison with similar homes in the area
Home Values in the Area
Average Home Value in this Area
Purchase History
| Date | Buyer | Sale Price | Title Company |
|---|---|---|---|
| Harvey Joseph L | $255,000 | Burnet Title | |
| Nje Holdings Llc | $3,000 | Titlenexus Llc | |
| Wilmington Savings Fund Society Fsb | -- | None Available | |
| Roehlke Shawn | $185,500 | -- | |
| Ramos Kathleen J | $172,000 | -- | |
| Brustuen Michael T | $129,500 | -- | |
| Chederquist Kevin J | $24,000 | -- |
Source: Public Records
Mortgage History
| Date | Status | Borrower | Loan Amount |
|---|---|---|---|
| Open | Harvey Joseph L | $250,381 |
Source: Public Records
Tax History Compared to Growth
Tax History
| Year | Tax Paid | Tax Assessment Tax Assessment Total Assessment is a certain percentage of the fair market value that is determined by local assessors to be the total taxable value of land and additions on the property. | Land | Improvement |
|---|---|---|---|---|
| 2025 | $4,824 | $327,000 | $44,000 | $283,000 |
| 2024 | $4,362 | $315,700 | $44,000 | $271,700 |
| 2023 | $4,204 | $307,100 | $33,500 | $273,600 |
| 2022 | $4,320 | $277,800 | $33,500 | $244,300 |
| 2021 | $3,926 | $249,300 | $26,000 | $223,300 |
| 2020 | $3,670 | $214,500 | $26,000 | $188,500 |
| 2019 | $3,700 | $201,900 | $0 | $0 |
| 2018 | $2,804 | $172,000 | $0 | $0 |
| 2017 | $2,320 | $157,900 | $0 | $0 |
| 2016 | $2,206 | $0 | $0 | $0 |
| 2015 | $2,036 | $0 | $0 | $0 |
| 2014 | -- | $0 | $0 | $0 |
Source: Public Records
Map
Nearby Homes
- 640 Robert Ave N
- 713 Danielson Ct
- XXXX Highway 55
- 416 5th St NW
- 412 5th St NW
- 329 Geneva Ln
- 921 Cedar Ave N
- 1000 Chestnut St
- 1030 Aspen Cir
- 520 Ramey Rd
- 451 Marian Dr
- 4616 Fillmore Ave NW
- XX 63rd St NW
- 4140 Fillmore Ave NW
- 7491 County Road 37 NW
- 8129 Griffith Ave NW
- 6714 80th St NW
- 6455 Illsley Ave NW
- 7457 Ingram Ave NW
- XXX County Road 7 NW
- 621 Robert Ave N
- 641 Robert Ave N
- 611 Robert Ave N
- 630 Robert Ave N
- 651 Robert Ave N
- 620 Robert Ave N
- 610 Robert Ave N
- 650 Robert Ave N
- 601 Robert Ave N
- 701 Robert Ave N
- 330 6th St NW
- 621 Maple Ave N
- 711 Robert Ave N
- 641 Maple Ave N
- 631 Maple Ave N
- 320 6th St NW
- 651 Maple Ave N
- XX Robert Ave N
- 611 Maple Ave N
- 710 Robert Ave N