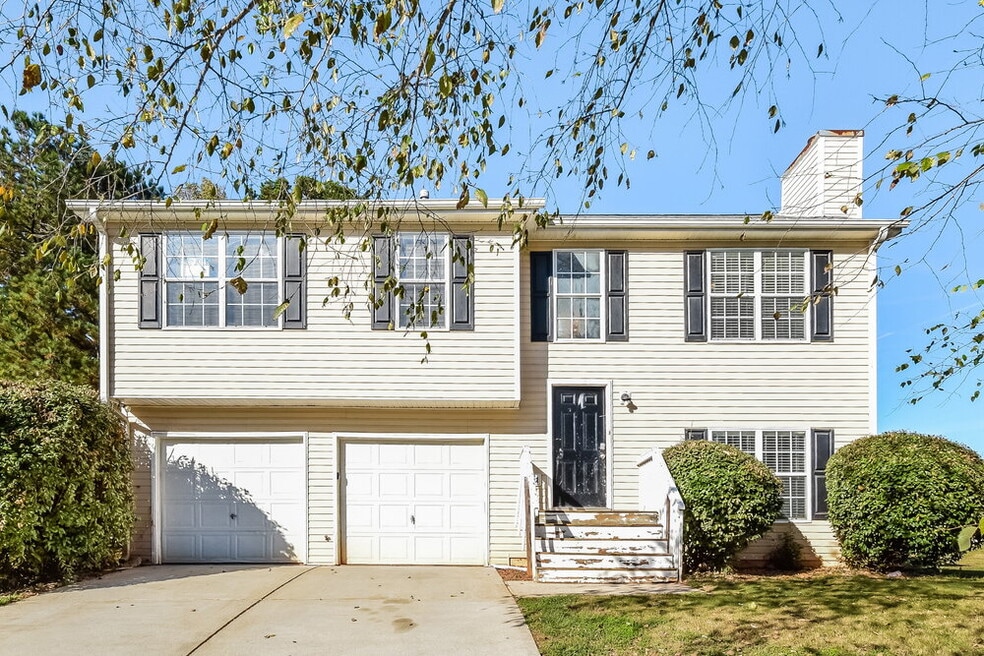
631 Sinclair Way Jonesboro, GA 30238
About This Home
Please note, our homes are available on a first-come, first-serve basis and are not reserved until the holding fee agreement is signed and the holding fee is paid by the primary applicant.
This home features Progress Smart Home - Progress Residential's smart home app, which allows you to control the home securely from any of your devices. Learn more at
This home is priced to rent and won't be around for long. Apply now, while we make this home ready for you, or call to arrange a meeting with your local Progress Residential leasing specialist today.
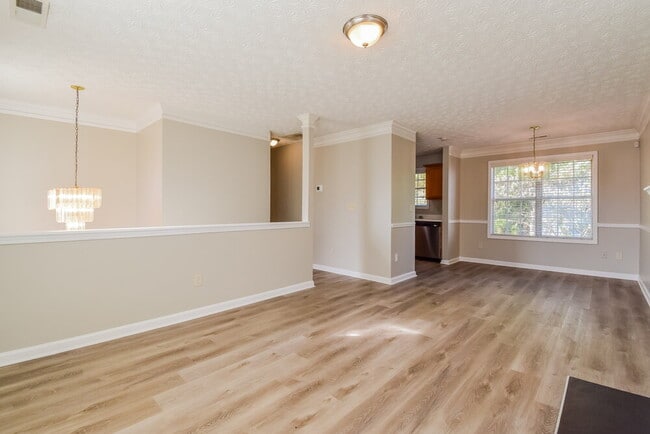
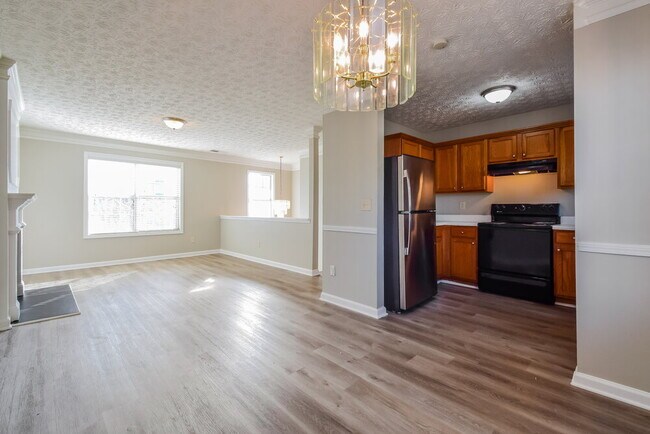
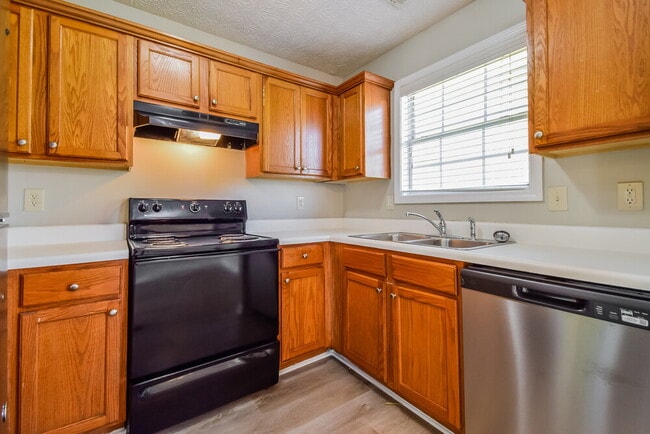
Interested in this home? You clearly have exceptional taste. This charming 3.0-bedroom, 2.5-bathroom home is not only pet-friendly, but also equipped with smart home features to make everyday life more convenient and connected. Homes like this don’t stay on the market for long—don’t miss your chance to make it yours. Apply today!
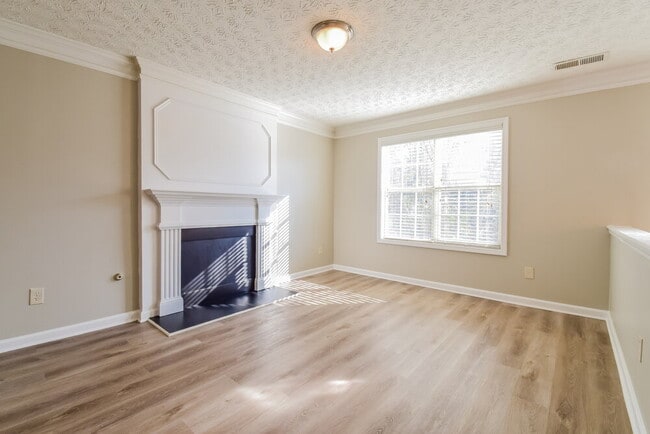
Some images have been virtually staged to help showcase the potential of spaces in the home. The furnishings shown are for illustrative purposes only and are not included in the home.

Map
Property History
| Date | Event | Price | List to Sale | Price per Sq Ft |
|---|---|---|---|---|
| 12/12/2025 12/12/25 | Price Changed | $1,980 | -0.3% | $1 / Sq Ft |
| 12/11/2025 12/11/25 | Price Changed | $1,985 | -0.3% | $1 / Sq Ft |
| 12/11/2025 12/11/25 | Price Changed | $1,990 | -18.4% | $1 / Sq Ft |
| 12/10/2025 12/10/25 | Price Changed | $2,440 | 0.0% | $1 / Sq Ft |
| 12/10/2025 12/10/25 | For Rent | $2,440 | +40.2% | -- |
| 01/15/2025 01/15/25 | Off Market | $1,740 | -- | -- |
| 01/08/2025 01/08/25 | Price Changed | $1,740 | -0.3% | $1 / Sq Ft |
| 01/07/2025 01/07/25 | Price Changed | $1,745 | -0.9% | $1 / Sq Ft |
| 01/06/2025 01/06/25 | For Rent | $1,760 | 0.0% | -- |
| 01/06/2025 01/06/25 | Price Changed | $1,760 | -1.4% | $1 / Sq Ft |
| 12/21/2024 12/21/24 | Off Market | $1,785 | -- | -- |
| 12/11/2024 12/11/24 | Price Changed | $1,785 | -1.9% | $1 / Sq Ft |
| 12/11/2024 12/11/24 | Price Changed | $1,820 | -4.2% | $1 / Sq Ft |
| 12/07/2024 12/07/24 | Price Changed | $1,900 | -1.0% | $1 / Sq Ft |
| 12/05/2024 12/05/24 | Price Changed | $1,920 | -0.3% | $1 / Sq Ft |
| 12/04/2024 12/04/24 | Price Changed | $1,925 | +0.5% | $1 / Sq Ft |
| 12/03/2024 12/03/24 | Price Changed | $1,915 | -4.3% | $1 / Sq Ft |
| 11/26/2024 11/26/24 | Price Changed | $2,000 | -0.2% | $1 / Sq Ft |
| 11/25/2024 11/25/24 | Price Changed | $2,005 | -2.9% | $1 / Sq Ft |
| 11/24/2024 11/24/24 | Price Changed | $2,065 | +1.7% | $1 / Sq Ft |
| 11/20/2024 11/20/24 | Price Changed | $2,030 | -1.9% | $1 / Sq Ft |
| 11/19/2024 11/19/24 | Price Changed | $2,070 | +0.2% | $1 / Sq Ft |
| 11/17/2024 11/17/24 | Price Changed | $2,065 | -0.2% | $1 / Sq Ft |
| 11/08/2024 11/08/24 | Price Changed | $2,070 | -0.7% | $1 / Sq Ft |
| 11/07/2024 11/07/24 | Price Changed | $2,085 | +0.5% | $1 / Sq Ft |
| 11/06/2024 11/06/24 | Price Changed | $2,075 | +0.2% | $1 / Sq Ft |
| 11/03/2024 11/03/24 | Price Changed | $2,070 | -1.7% | $1 / Sq Ft |
| 11/01/2024 11/01/24 | Price Changed | $2,105 | -0.2% | $1 / Sq Ft |
| 10/30/2024 10/30/24 | Price Changed | $2,110 | +1.0% | $1 / Sq Ft |
| 10/29/2024 10/29/24 | Price Changed | $2,090 | -0.9% | $1 / Sq Ft |
| 10/23/2024 10/23/24 | Price Changed | $2,110 | -0.2% | $1 / Sq Ft |
| 10/22/2024 10/22/24 | Price Changed | $2,115 | -1.6% | $1 / Sq Ft |
| 10/21/2024 10/21/24 | Price Changed | $2,150 | -0.2% | $1 / Sq Ft |
| 10/18/2024 10/18/24 | Price Changed | $2,155 | +0.5% | $1 / Sq Ft |
| 10/16/2024 10/16/24 | Price Changed | $2,145 | -26.0% | $1 / Sq Ft |
| 10/14/2024 10/14/24 | For Rent | $2,900 | +224.0% | -- |
| 04/29/2014 04/29/14 | Rented | $895 | 0.0% | -- |
| 02/01/2014 02/01/14 | Under Contract | -- | -- | -- |
| 10/05/2013 10/05/13 | For Rent | $895 | -- | -- |
- 800 Sinclair Way
- 10411 Ivygate Terrace
- 696 Tara Rd
- LOT Hunter Ridge Dr
- 1157 Forest Glen
- 10283 Richfield Ct
- 10410 Iron Gate Ln
- 1117 Village Creek
- 10588 Fitzgerald Rd
- 1036 Walnut Creek Ln
- 1159 Bonita Way Unit 10
- 1224 Bonita Cir
- 10200 Commons Crossing Unit 1
- 10779 Tara Village Way
- 1091 Commons Ct Unit 2
- 10197 Hamilton Glen
- 1241 Larkwood Dr
- 10617 Barberry Dr
- 10990 Clearwater Dr
- 9997 Point View Dr
- 1016 Forest Glen
- 10438 Ivygate Terrace
- 664 Rosewood Cir
- 10635 Pine Forest Ln
- 696 Tara Rd
- 10283 Richfield Ct
- 10587 Village Trail
- 1100 Village Oaks
- 10576 Day Lily Dr
- 10806 Misty Meadows Ct
- 10270 Misty Ridge Dr
- 10366 Candlelight Rd
- 10993 Clearwater Dr
- 10650 Daisy Cove
- 1195 Misty Meadows Way
- 10119 Port Royal Ct
- 343 Layfield Dr
- 540 Washington Dr
- 9908 Point View Dr
- 1327 Labelle St