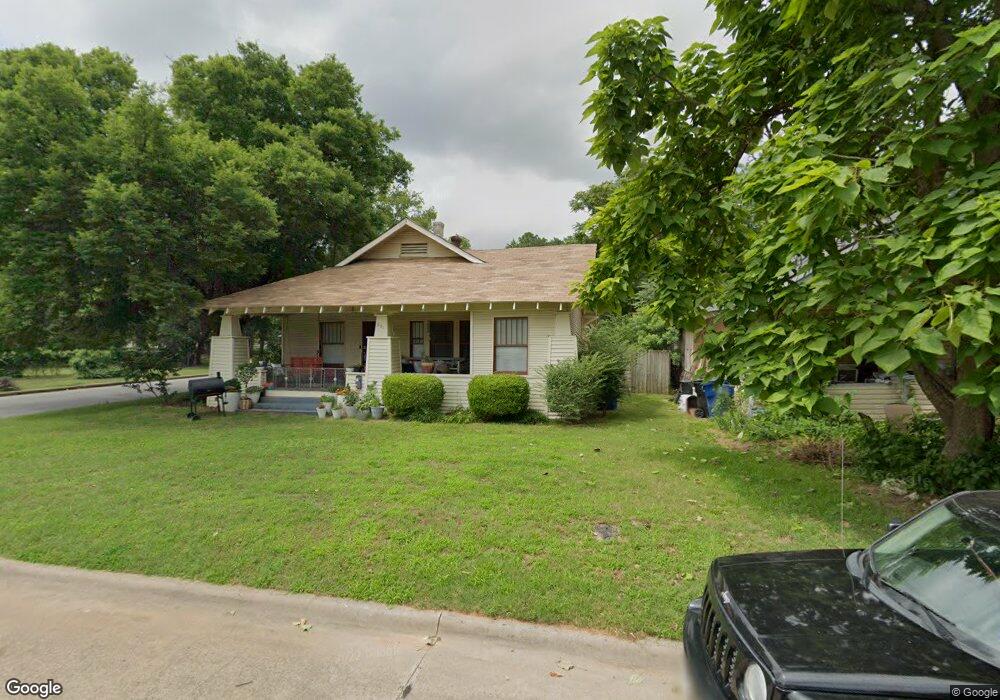
631 W Heron St Denison, TX 75020
Estimated Value: $157,183 - $195,000
Studio
1
Bath
1,428
Sq Ft
$123/Sq Ft
Est. Value
About This Home
This home is located at 631 W Heron St, Denison, TX 75020 and is currently estimated at $176,092, approximately $123 per square foot. 631 W Heron St is a home located in Grayson County with nearby schools including Houston Elementary School, Scott Middle School, and Denison High School.
Ownership History
Date
Name
Owned For
Owner Type
Purchase Details
Closed on
Jun 4, 2025
Sold by
Fitch Aviation Holdings Llc
Bought by
Bmb Investment Holdings Llc
Current Estimated Value
Home Financials for this Owner
Home Financials are based on the most recent Mortgage that was taken out on this home.
Original Mortgage
$85,000
Outstanding Balance
$84,783
Interest Rate
6.83%
Mortgage Type
Seller Take Back
Estimated Equity
$91,309
Purchase Details
Closed on
May 29, 2025
Sold by
Livingston Whitney Katti
Bought by
Fitch Aviation Holdings Llc
Home Financials for this Owner
Home Financials are based on the most recent Mortgage that was taken out on this home.
Original Mortgage
$85,000
Outstanding Balance
$84,783
Interest Rate
6.83%
Mortgage Type
Seller Take Back
Estimated Equity
$91,309
Purchase Details
Closed on
Oct 14, 2021
Sold by
Livingston Karol Ann
Bought by
Livingston Whitney Katti
Home Financials for this Owner
Home Financials are based on the most recent Mortgage that was taken out on this home.
Original Mortgage
$85,000
Interest Rate
2.8%
Mortgage Type
New Conventional
Create a Home Valuation Report for This Property
The Home Valuation Report is an in-depth analysis detailing your home's value as well as a comparison with similar homes in the area
Home Values in the Area
Average Home Value in this Area
Purchase History
| Date | Buyer | Sale Price | Title Company |
|---|---|---|---|
| Bmb Investment Holdings Llc | -- | None Listed On Document | |
| Fitch Aviation Holdings Llc | -- | None Listed On Document | |
| Livingston Whitney Katti | -- | Chicago Title |
Source: Public Records
Mortgage History
| Date | Status | Borrower | Loan Amount |
|---|---|---|---|
| Open | Fitch Aviation Holdings Llc | $85,000 | |
| Previous Owner | Livingston Whitney Katti | $85,000 |
Source: Public Records
Tax History
| Year | Tax Paid | Tax Assessment Tax Assessment Total Assessment is a certain percentage of the fair market value that is determined by local assessors to be the total taxable value of land and additions on the property. | Land | Improvement |
|---|---|---|---|---|
| 2025 | $3,932 | $152,376 | $40,800 | $111,576 |
| 2024 | $3,932 | $169,258 | $52,500 | $116,758 |
| 2023 | $3,490 | $154,053 | $31,500 | $122,553 |
| 2022 | $3,466 | $145,890 | $31,500 | $114,390 |
| 2021 | $2,505 | $112,570 | $16,200 | $96,370 |
| 2020 | $2,381 | $104,935 | $13,500 | $91,435 |
| 2019 | $2,258 | $100,797 | $8,160 | $92,637 |
| 2018 | $2,070 | $82,759 | $6,960 | $75,799 |
| 2017 | $1,898 | $71,421 | $2,880 | $68,541 |
| 2016 | $1,725 | $74,264 | $2,700 | $71,564 |
| 2015 | $0 | $61,325 | $3,240 | $58,085 |
| 2014 | -- | $50,959 | $3,240 | $47,719 |
Source: Public Records
Map
Nearby Homes
- 700 W Monterey St
- 715 W Monterey St
- 704 W Hull St
- TBD W Texas St
- 1401 W Texas St
- 0000 W Texas St
- 701 W Hull St Unit 101-2
- 1011 S Armstrong Ave
- 513 W Texas St
- 415 W Monterey St
- 709 W Hanna St
- 1500 S Scullin Ave
- 525 W Hanna St
- 217 W Acheson St
- 1007 S Scullin Ave
- 422 W Acheson St
- 328 W Murray St
- 330 W Texas St
- 621 W Munson St
- 430 W Munson St
- 625 W Heron St
- 621 W Heron St
- 630 W Monterey St
- 615 W Heron St
- 624 W Monterey St
- 701 W Heron St
- 618 W Monterey St
- 618 W Monterey St
- 1300 S Barrett Ave
- 614 W Monterey St
- 711 W Heron St
- 612 W Monterey St
- 610 W Heron St
- 700 W Heron St
- 710 W Monterey St
- 1306 S Barrett Ave
- 715 W Heron St
- 608 W Monterey St
- 714 W Monterey St
- 1217 S Mirick Ave
Your Personal Tour Guide
Ask me questions while you tour the home.