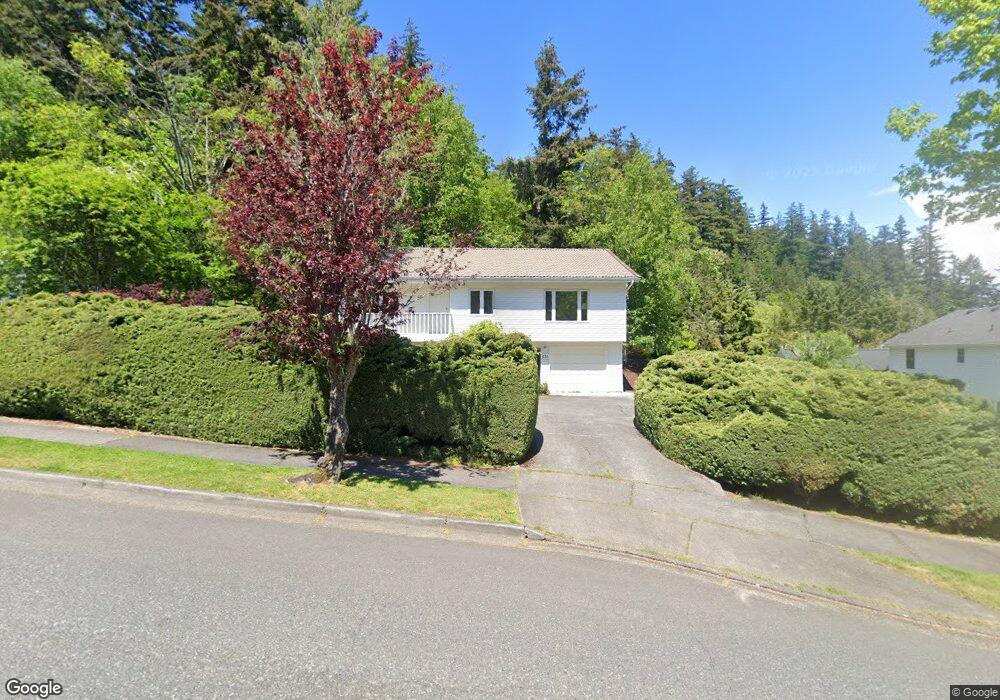
631 Willow Rd Bellingham, WA 98225
Edgemoor NeighborhoodEstimated Value: $764,952 - $1,023,000
2
Beds
2
Baths
1,374
Sq Ft
$654/Sq Ft
Est. Value
About This Home
This home is located at 631 Willow Rd, Bellingham, WA 98225 and is currently estimated at $898,738, approximately $654 per square foot. 631 Willow Rd is a home located in Whatcom County with nearby schools including Happy Valley Elementary School, Fairhaven Middle School, and Sehome High School.
Create a Home Valuation Report for This Property
The Home Valuation Report is an in-depth analysis detailing your home's value as well as a comparison with similar homes in the area
Home Values in the Area
Average Home Value in this Area
Tax History Compared to Growth
Tax History
| Year | Tax Paid | Tax Assessment Tax Assessment Total Assessment is a certain percentage of the fair market value that is determined by local assessors to be the total taxable value of land and additions on the property. | Land | Improvement |
|---|---|---|---|---|
| 2024 | $5,625 | $697,844 | $304,092 | $393,752 |
| 2023 | $5,625 | $722,793 | $314,964 | $407,829 |
| 2022 | $4,631 | $615,147 | $268,056 | $347,091 |
| 2021 | $4,400 | $496,099 | $216,180 | $279,919 |
| 2020 | $4,323 | $435,171 | $189,630 | $245,541 |
| 2019 | $4,148 | $413,072 | $180,000 | $233,072 |
| 2018 | $4,289 | $397,426 | $162,208 | $235,218 |
| 2017 | $3,783 | $352,771 | $143,980 | $208,791 |
| 2016 | $3,444 | $324,857 | $132,480 | $192,377 |
| 2015 | $3,390 | $308,108 | $125,580 | $182,528 |
| 2014 | -- | $293,428 | $119,600 | $173,828 |
| 2013 | -- | $279,144 | $115,000 | $164,144 |
Source: Public Records
Map
Nearby Homes
- 1301 Broad St
- 507 Lyla Ln
- 331 Chuckanut Dr N
- 425 Chuckanut Dr N Unit 5
- 2600 16th St
- 404 Willow Road Place
- 406 Willow Road Place
- 505 Willow Rd
- 624 Clark Rd
- 214 Bayside Rd
- 1212 Old Fairhaven Pkwy Unit D202
- 405 Bayside Rd
- 1302 Larrabee Ave
- 707 Donovan Ave
- 1605 Donovan Ave
- 1902 Wilson Ave
- 671 Chuckanut Dr N
- 910 Harris Ave Unit 208
- 910 Harris Ave Unit 304
- 697 Chuckanut Dr N
- 318 Willow Ct N
- 625 Willow Rd
- 316 Willow Ct N
- 623 Willow Rd
- 630 Willow Rd
- 621 Willow Ct S
- 314 Willow Ct N
- 501 Cypress Rd
- 309 Willow Ct N
- 621 Willow Rd
- 617 Willow Ct S
- 312 Willow Ct N
- 501 Willow Ct S
- 619 Willow Rd
- 503 Cypress Rd
- 613 Willow Ct S
- 703 Willow Rd
- 500 Cypress Rd
- 310 Willow Ct N
- 401 Parkridge Rd