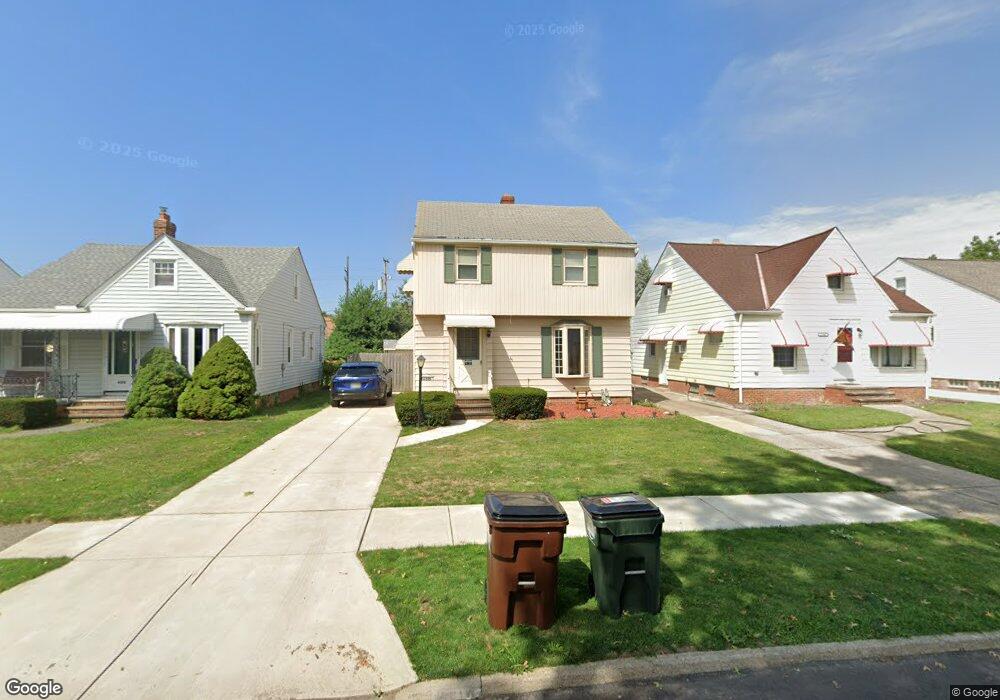
6310 Alber Ave Cleveland, OH 44129
Estimated Value: $189,000 - $203,049
3
Beds
1
Bath
1,264
Sq Ft
$154/Sq Ft
Est. Value
About This Home
This home is located at 6310 Alber Ave, Cleveland, OH 44129 and is currently estimated at $194,512, approximately $153 per square foot. 6310 Alber Ave is a home located in Cuyahoga County with nearby schools including Thoreau Park Elementary School, Shiloh Middle School, and Parma High School.
Ownership History
Date
Name
Owned For
Owner Type
Purchase Details
Closed on
Mar 12, 2001
Sold by
Otter David
Bought by
Darovich John G and Kolczynski Julie A
Current Estimated Value
Home Financials for this Owner
Home Financials are based on the most recent Mortgage that was taken out on this home.
Original Mortgage
$116,166
Outstanding Balance
$42,806
Interest Rate
7.18%
Mortgage Type
FHA
Estimated Equity
$151,706
Purchase Details
Closed on
Apr 19, 2000
Sold by
David Otter and Otter Barbara D
Bought by
Otter David and Otter Barbara D
Purchase Details
Closed on
Jul 21, 1994
Sold by
Windisch George M
Bought by
Otter David and Otter Barbara D
Home Financials for this Owner
Home Financials are based on the most recent Mortgage that was taken out on this home.
Original Mortgage
$67,000
Interest Rate
8.38%
Mortgage Type
New Conventional
Purchase Details
Closed on
Jun 12, 1992
Sold by
Windisch George M and B G
Bought by
Windisch George M
Purchase Details
Closed on
Jan 1, 1975
Bought by
Windisch George M and B G
Create a Home Valuation Report for This Property
The Home Valuation Report is an in-depth analysis detailing your home's value as well as a comparison with similar homes in the area
Home Values in the Area
Average Home Value in this Area
Purchase History
| Date | Buyer | Sale Price | Title Company |
|---|---|---|---|
| Darovich John G | -- | -- | |
| Darovich John G | $18,000 | -- | |
| Otter David | -- | -- | |
| Otter Barbara D | -- | -- | |
| Otter David | $87,000 | -- | |
| Windisch George M | -- | -- | |
| Windisch George M | -- | -- |
Source: Public Records
Mortgage History
| Date | Status | Borrower | Loan Amount |
|---|---|---|---|
| Open | Darovich John G | $116,166 | |
| Previous Owner | Otter David | $67,000 |
Source: Public Records
Tax History Compared to Growth
Tax History
| Year | Tax Paid | Tax Assessment Tax Assessment Total Assessment is a certain percentage of the fair market value that is determined by local assessors to be the total taxable value of land and additions on the property. | Land | Improvement |
|---|---|---|---|---|
| 2024 | $3,629 | $59,850 | $11,060 | $48,790 |
| 2023 | $3,163 | $44,660 | $9,800 | $34,860 |
| 2022 | $3,133 | $44,660 | $9,800 | $34,860 |
| 2021 | $3,223 | $44,660 | $9,800 | $34,860 |
| 2020 | $2,820 | $34,340 | $7,530 | $26,810 |
| 2019 | $2,701 | $98,100 | $21,500 | $76,600 |
| 2018 | $2,658 | $34,340 | $7,530 | $26,810 |
| 2017 | $2,597 | $29,830 | $5,850 | $23,980 |
| 2016 | $2,581 | $29,830 | $5,850 | $23,980 |
| 2015 | $2,471 | $29,830 | $5,850 | $23,980 |
| 2014 | $2,471 | $30,420 | $5,950 | $24,470 |
Source: Public Records
Map
Nearby Homes
- 6506 Snow Rd
- 6021 Snow Rd
- 6706 Alber Ave
- 6403 Kenneth Ave
- 6704 Charles Ave
- 5815 Wilber Ave
- 6903 Alber Ave
- 6306 Gilbert Ave
- 6818 Hampstead Ave
- 6711 Forest Ave
- 5914 Forest Ave
- 6903 Forest Ave
- 7115 Hampstead Ave
- 6708 Thornton Dr
- 7014 Thornton Dr
- 5603 Allanwood Dr
- 5815 Westlake Ave
- 7615 Bertha Ave
- 7514 Spring Garden Rd
- 5212 Wood Ave