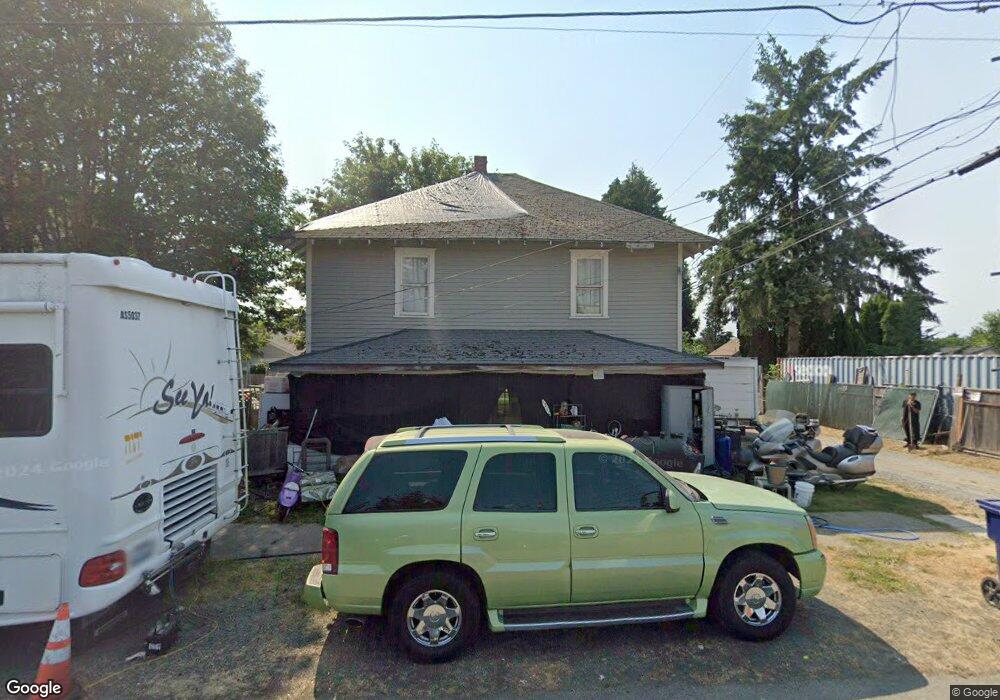
6310 E F St Tacoma, WA 98404
Eastside Neighborhood
--
Bed
1
Bath
1,716
Sq Ft
0.28
Acres
About This Home
This home is located at 6310 E F St, Tacoma, WA 98404. 6310 E F St is a home located in Pierce County with nearby schools including Oakland High School, Hunt Middle School, and Mount Tahoma High School.
Ownership History
Date
Name
Owned For
Owner Type
Purchase Details
Closed on
Dec 6, 2011
Sold by
Board Of Congregational Development Of T
Bought by
Holy Trinity Church Of God In Christ
Home Financials for this Owner
Home Financials are based on the most recent Mortgage that was taken out on this home.
Original Mortgage
$200,000
Outstanding Balance
$136,287
Interest Rate
3.93%
Mortgage Type
Unknown
Purchase Details
Closed on
Dec 1, 2009
Sold by
Calvary United Methodist Church
Bought by
Board Of Congregational Development Of T
Create a Home Valuation Report for This Property
The Home Valuation Report is an in-depth analysis detailing your home's value as well as a comparison with similar homes in the area
Home Values in the Area
Average Home Value in this Area
Purchase History
| Date | Buyer | Sale Price | Title Company |
|---|---|---|---|
| Holy Trinity Church Of God In Christ | $200,000 | Chicago Title Company | |
| Board Of Congregational Development Of T | -- | None Available |
Source: Public Records
Mortgage History
| Date | Status | Borrower | Loan Amount |
|---|---|---|---|
| Open | Holy Trinity Church Of God In Christ | $200,000 |
Source: Public Records
Tax History Compared to Growth
Tax History
| Year | Tax Paid | Tax Assessment Tax Assessment Total Assessment is a certain percentage of the fair market value that is determined by local assessors to be the total taxable value of land and additions on the property. | Land | Improvement |
|---|---|---|---|---|
| 2025 | $10 | $512,400 | $198,600 | $313,800 |
| 2024 | $10 | $504,900 | $180,600 | $324,300 |
| 2023 | $10 | $476,900 | $180,600 | $296,300 |
| 2022 | $10 | $440,700 | $180,600 | $260,100 |
| 2021 | $10 | $406,400 | $157,000 | $249,400 |
| 2019 | $8 | $321,000 | $57,400 | $263,600 |
| 2018 | $7 | $306,200 | $52,300 | $253,900 |
| 2017 | $6 | $290,200 | $47,300 | $242,900 |
| 2016 | $5 | $287,700 | $47,300 | $240,400 |
| 2014 | $2,396 | $287,700 | $47,300 | $240,400 |
| 2013 | $2,396 | $284,700 | $83,500 | $201,200 |
Source: Public Records
Map
Nearby Homes