
Seller's Agent in 2025
Kelly Huffstetler
Keller Williams Legacy
(919) 522-6349
12 in this area
101 Total Sales
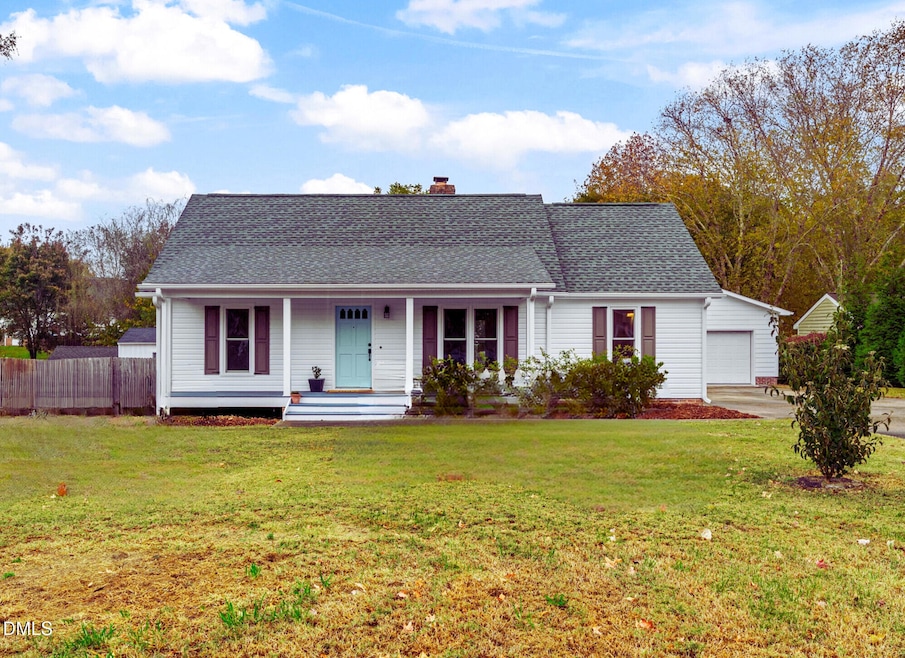
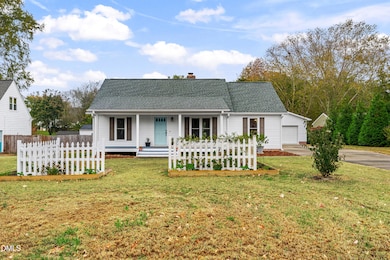
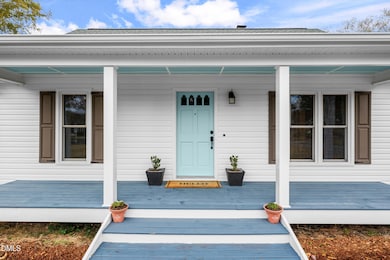
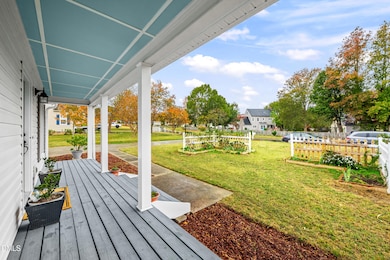
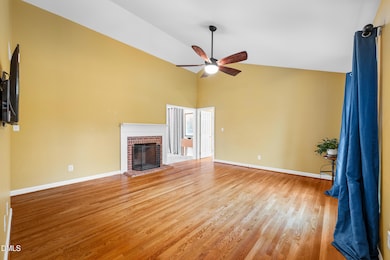
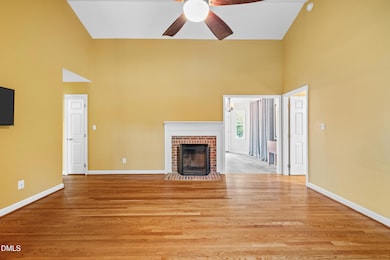
Charming, updated, and move-in ready — this 3 bedroom, 2 bath ranch sits on nearly half an acre with NO HOA in a prime Wake Forest location. Recent updates include new vinyl siding, vinyl-wrapped porch columns, new back door, and a beautifully renovated kitchen featuring new cabinets, quartz countertops, stainless appliances, sink, and flooring. Both bathrooms have been refreshed, including new fixtures, LVP flooring, and wainscoting in the main bath.
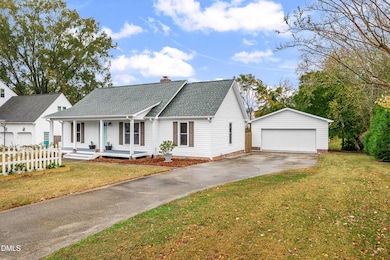
Outside, the large, flat, fenced backyard offers space to play, garden, relax, or entertain. The detached 2-car garage (500+ sq ft) is insulated and powered, making it truly versatile — perfect for workshop, home gym, craft space, game room, movie hangout, or storage, with year-round usability when supplemented with a window unit or space heater.
A rare combination of updates, usable outdoor space, storage, and freedom — all on one level and close to everything Wake Forest has to offer.
Last Agent to Sell the Property
Keller Williams Legacy License #244799 Listed on: 10/31/2025
| Date | Type | Sale Price | Title Company |
|---|---|---|---|
| Warranty Deed | $325,000 | None Listed On Document | |
| Warranty Deed | $217,500 | None Available | |
| Warranty Deed | $84,000 | None Available | |
| Interfamily Deed Transfer | -- | -- | |
| Deed | $88,500 | -- |
| Date | Status | Loan Amount | Loan Type |
|---|---|---|---|
| Open | $227,500 | New Conventional | |
| Previous Owner | $172,000 | New Conventional | |
| Previous Owner | $162,960 | New Conventional |
| Date | Event | Price | List to Sale | Price per Sq Ft |
|---|---|---|---|---|
| 12/29/2025 12/29/25 | Sold | $325,000 | 0.0% | $277 / Sq Ft |
| 11/23/2025 11/23/25 | Pending | -- | -- | -- |
| 11/21/2025 11/21/25 | Price Changed | $325,000 | -4.4% | $277 / Sq Ft |
| 10/31/2025 10/31/25 | For Sale | $340,000 | -- | $290 / Sq Ft |
| Year | Tax Paid | Tax Assessment Tax Assessment Total Assessment is a certain percentage of the fair market value that is determined by local assessors to be the total taxable value of land and additions on the property. | Land | Improvement |
|---|---|---|---|---|
| 2025 | $2,172 | $336,445 | $110,000 | $226,445 |
| 2024 | $2,109 | $336,445 | $110,000 | $226,445 |
| 2023 | $1,603 | $203,063 | $55,000 | $148,063 |
| 2022 | $1,487 | $203,063 | $55,000 | $148,063 |
| 2021 | $1,447 | $203,063 | $55,000 | $148,063 |
| 2020 | $1,423 | $203,063 | $55,000 | $148,063 |
| 2019 | $1,334 | $160,836 | $40,000 | $120,836 |
| 2018 | $0 | $141,236 | $40,000 | $101,236 |
| 2017 | $1,024 | $141,236 | $40,000 | $101,236 |
| 2016 | $0 | $141,236 | $40,000 | $101,236 |
| 2015 | -- | $135,633 | $40,000 | $95,633 |
| 2014 | -- | $135,633 | $40,000 | $95,633 |
Seller's Agent in 2025
Kelly Huffstetler
Keller Williams Legacy
(919) 522-6349
12 in this area
101 Total Sales
Buyer's Agent in 2025
Regina Jones
Onwire Realty LLC
(704) 713-5799
2 in this area
18 Total Sales
Source: Doorify MLS
MLS Number: 10130772
APN: 1850.04-72-9028-000
Disclaimer: Certain information contained herein is derived from information provided by parties other than Homes.com. All information provided is deemed reliable, but is not guaranteed to be accurate and should be independently verified.
![]() Some IDX listings have been excluded from this IDX display. Brokers make an effort to deliver accurate information, but buyers should independently verify any information on which they will rely in a transaction. The listing broker shall not be responsible for any typographical errors, misinformation, or misprints, and they shall be held totally harmless from any damages arising from reliance upon this data. This data is provided exclusively for consumers’ personal, non-commercial use. Listings marked with an icon are provided courtesy of the Doorify MLS, Inc. of North Carolina, Internet Data Exchange Database. Closed (sold) listings may have been listed and/or sold by a real estate firm other than the firm(s) featured on this website. Closed data is not available until the sale of the property is recorded in the MLS. Home sale data is not an appraisal, CMA, competitive or comparative market analysis, or home valuation of any property. Copyright 2026 Doorify MLS, Inc. of North Carolina. All rights reserved.
Some IDX listings have been excluded from this IDX display. Brokers make an effort to deliver accurate information, but buyers should independently verify any information on which they will rely in a transaction. The listing broker shall not be responsible for any typographical errors, misinformation, or misprints, and they shall be held totally harmless from any damages arising from reliance upon this data. This data is provided exclusively for consumers’ personal, non-commercial use. Listings marked with an icon are provided courtesy of the Doorify MLS, Inc. of North Carolina, Internet Data Exchange Database. Closed (sold) listings may have been listed and/or sold by a real estate firm other than the firm(s) featured on this website. Closed data is not available until the sale of the property is recorded in the MLS. Home sale data is not an appraisal, CMA, competitive or comparative market analysis, or home valuation of any property. Copyright 2026 Doorify MLS, Inc. of North Carolina. All rights reserved.
Ask me questions while you tour the home.