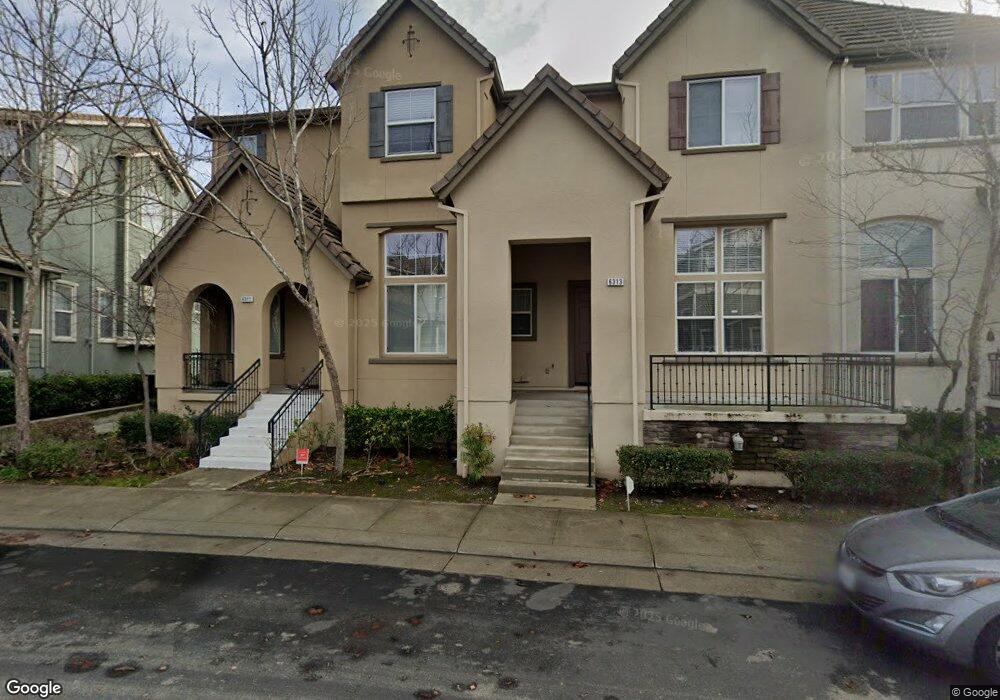
6313 Byron Ln Unit 117 San Ramon, CA 94582
Gale Ranch-Windemere NeighborhoodEstimated Value: $1,079,000 - $1,106,625
3
Beds
3
Baths
2,180
Sq Ft
$502/Sq Ft
Est. Value
About This Home
This home is located at 6313 Byron Ln Unit 117, San Ramon, CA 94582 and is currently estimated at $1,095,406, approximately $502 per square foot. 6313 Byron Ln Unit 117 is a home located in Contra Costa County with nearby schools including Live Oak Elementary School, Windemere Ranch Middle School, and Dougherty Valley High School.
Ownership History
Date
Name
Owned For
Owner Type
Purchase Details
Closed on
Sep 29, 2011
Sold by
Cherukupalli Ravi Kant and Cherukupalli Madhubala
Bought by
Cherukupalli Ravi Kant and Cherukupalli Madhubala
Current Estimated Value
Purchase Details
Closed on
May 17, 2011
Sold by
Cherukupalli Ravi Kant and Cherukupalli Madhubala
Bought by
Cherukupalli Ravi Kant and Cherukupalli Madbubala
Purchase Details
Closed on
Apr 10, 2011
Sold by
Cherukupalli Ravi Kant and Cherukupalli Madhubala
Bought by
Cherukupalli Ravi Kant and Cherukupalli Madhubala
Purchase Details
Closed on
Sep 7, 2007
Sold by
Centex Homes
Bought by
Cherukupalli Ravi K and Cherukupalli Madhubala
Home Financials for this Owner
Home Financials are based on the most recent Mortgage that was taken out on this home.
Original Mortgage
$66,875
Outstanding Balance
$55,189
Interest Rate
6.67%
Mortgage Type
Credit Line Revolving
Estimated Equity
$1,040,217
Create a Home Valuation Report for This Property
The Home Valuation Report is an in-depth analysis detailing your home's value as well as a comparison with similar homes in the area
Home Values in the Area
Average Home Value in this Area
Purchase History
| Date | Buyer | Sale Price | Title Company |
|---|---|---|---|
| Cherukupalli Ravi Kant | -- | None Available | |
| Cherukupalli Ravi Kant | -- | None Available | |
| Cherukupalli Ravi Kant | -- | None Available | |
| Cherukupalli Ravi K | $669,000 | First American Title Co |
Source: Public Records
Mortgage History
| Date | Status | Borrower | Loan Amount |
|---|---|---|---|
| Open | Cherukupalli Ravi K | $66,875 |
Source: Public Records
Tax History Compared to Growth
Tax History
| Year | Tax Paid | Tax Assessment Tax Assessment Total Assessment is a certain percentage of the fair market value that is determined by local assessors to be the total taxable value of land and additions on the property. | Land | Improvement |
|---|---|---|---|---|
| 2025 | $14,278 | $897,251 | $370,406 | $526,845 |
| 2024 | $14,092 | $879,659 | $363,144 | $516,515 |
| 2023 | $14,092 | $862,412 | $356,024 | $506,388 |
| 2022 | $13,858 | $845,503 | $349,044 | $496,459 |
| 2021 | $13,552 | $828,925 | $342,200 | $486,725 |
| 2019 | $13,257 | $804,341 | $332,051 | $472,290 |
| 2018 | $12,709 | $775,000 | $319,939 | $455,061 |
| 2017 | $12,393 | $741,000 | $305,903 | $435,097 |
| 2016 | $12,312 | $732,000 | $302,187 | $429,813 |
| 2015 | $11,904 | $698,500 | $288,358 | $410,142 |
| 2014 | $11,357 | $644,000 | $265,858 | $378,142 |
Source: Public Records
Map
Nearby Homes
- 6130 Yardley Ln
- 5430 Sherwood Way
- 1628 Banbury Dr
- 3055 Hastings Way
- 1132 Hoskins Ln
- 6278 Murdock Way
- 224 Riverland Ct
- 2392 Millstream Ln
- 2165 Watermill Rd Unit 54
- 6132 Alpine Blue Dr
- 5110 Rowan Dr
- 2073 Watermill Rd
- 301 Arrowleaf St
- 1412 Arianna Ln
- 1038 S Monarch Rd
- 4719 Malayan St
- 3422 Cinnamon Ridge Rd
- 6260 Main Branch Rd
- 4440 Pine Mountain Way
- 4519 Spring Mountain Way
- 6315 Byron Ln
- 6311 Byron Ln
- 6317 Byron Ln
- 6319 Byron Ln Unit 120
- 6279 Byron Ln Unit 110
- 6303 Byron Ln
- 6331 Byron Ln Unit 125
- 6307 Byron Ln Unit 124
- 6301 Byron Ln Unit 121
- 6333 Byron Ln Unit 126
- 6277 Byron Ln
- 6320 Byron Ln
- 6259 Byron Ln
- 6335 Byron Ln Unit 127
- 6275 Byron Ln Unit 108
- 6257 Byron Ln Unit 114
- 6337 Byron Ln
- 6322 Byron Ln Unit 76
- 6260 Byron Ln Unit 92
- 6273 Byron Ln