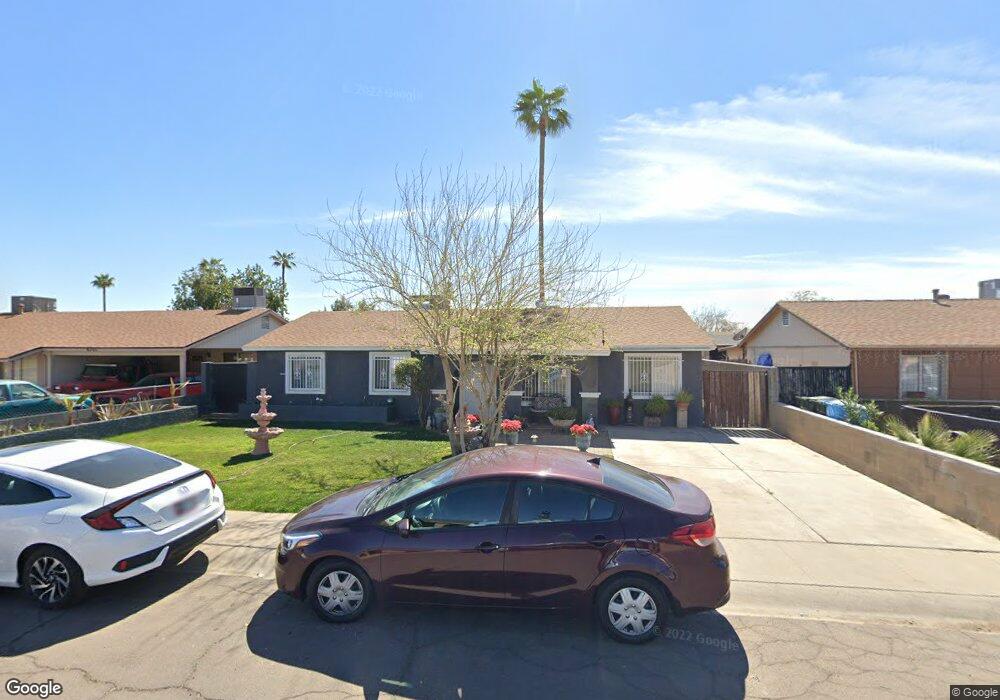
6313 W Cypress St Phoenix, AZ 85035
Estimated Value: $284,499 - $329,000
3
Beds
2
Baths
1,064
Sq Ft
$285/Sq Ft
Est. Value
About This Home
This home is located at 6313 W Cypress St, Phoenix, AZ 85035 and is currently estimated at $303,625, approximately $285 per square foot. 6313 W Cypress St is a home located in Maricopa County with nearby schools including Palm Lane Elementary School, Raul H. Castro Middle School, and Trevor Browne High School.
Ownership History
Date
Name
Owned For
Owner Type
Purchase Details
Closed on
Mar 25, 2004
Sold by
Ramos Navarro Enrique and Navarro Ramos Enrique
Bought by
Pena Jesus
Current Estimated Value
Home Financials for this Owner
Home Financials are based on the most recent Mortgage that was taken out on this home.
Original Mortgage
$108,250
Interest Rate
5.92%
Mortgage Type
Purchase Money Mortgage
Purchase Details
Closed on
Jun 19, 2000
Sold by
Gonzalez Maria Del Carmen
Bought by
Navarro Ramos Navarro Enrique and Navarro Ramos Enrique
Purchase Details
Closed on
Jun 12, 2000
Sold by
Brown Leland T
Bought by
Navarro Enrique Ramos and Gonzales Maria Del Carmen
Purchase Details
Closed on
Jan 18, 1996
Sold by
Brown Janet L
Bought by
Brown Leland T
Purchase Details
Closed on
Jan 16, 1996
Sold by
Friend Terry W and Friend Alice M
Bought by
Brown Leland T
Create a Home Valuation Report for This Property
The Home Valuation Report is an in-depth analysis detailing your home's value as well as a comparison with similar homes in the area
Purchase History
| Date | Buyer | Sale Price | Title Company |
|---|---|---|---|
| Pena Jesus | $108,250 | Westland Title Agency Of Az | |
| Navarro Ramos Navarro Enrique | -- | Grand Canyon Title Agency In | |
| Navarro Enrique Ramos | -- | Grand Canyon Title Agency In | |
| Brown Leland T | -- | Chicago Title Insurance Co | |
| Brown Leland T | -- | -- |
Source: Public Records
Mortgage History
| Date | Status | Borrower | Loan Amount |
|---|---|---|---|
| Previous Owner | Pena Jesus | $108,250 |
Source: Public Records
Tax History
| Year | Tax Paid | Tax Assessment Tax Assessment Total Assessment is a certain percentage of the fair market value that is determined by local assessors to be the total taxable value of land and additions on the property. | Land | Improvement |
|---|---|---|---|---|
| 2025 | $1,703 | $10,681 | -- | -- |
| 2024 | $1,698 | $10,172 | -- | -- |
| 2023 | $1,698 | $21,750 | $4,350 | $17,400 |
| 2022 | $1,595 | $17,310 | $3,460 | $13,850 |
| 2021 | $1,628 | $14,300 | $2,860 | $11,440 |
| 2020 | $1,536 | $13,020 | $2,600 | $10,420 |
| 2019 | $1,466 | $11,070 | $2,210 | $8,860 |
| 2018 | $694 | $9,430 | $1,880 | $7,550 |
| 2017 | $662 | $7,610 | $1,520 | $6,090 |
| 2016 | $632 | $6,470 | $1,290 | $5,180 |
| 2015 | $583 | $5,500 | $1,100 | $4,400 |
Source: Public Records
Map
Nearby Homes
- 6401 W Encanto Blvd
- 2223 N 62nd Ln
- 2042 N 64th Dr
- 6213 W Palm Ln
- 6224 W Berkeley Rd
- 1616 N 63rd Ave Unit 48
- 6423 W Almeria Rd
- 5940 W Palm Ln
- 5921 W Hubbell St
- 6643 W Cambridge Ave
- 6805 W Encanto Blvd
- 6814 W Berkeley Rd
- 2530 N 58th Ave
- 6502 W Thomas Rd
- 6209 W Cheery Lynn Rd
- 6929 W Monte Vista Rd
- 6408 W Avalon Dr
- 6063 W Earll Dr
- 6718 W Catalina Dr
- 6001 W Earll Dr
- 6317 W Cypress St
- 6307 W Cypress St
- 6314 W Monte Vista Rd
- 6308 W Monte Vista Rd
- 6320 W Monte Vista Rd
- 6323 W Cypress St
- 6301 W Cypress St
- 6308 W Cypress St
- 6302 W Monte Vista Rd
- 6320 W Cypress St
- 6324 W Monte Vista Rd
- 6329 W Cypress St
- 6302 W Cypress St
- 6324 W Cypress St
- 6313 W Encanto Blvd
- 6330 W Monte Vista Rd
- 6317 W Encanto Blvd
- 6307 W Encanto Blvd
- 6333 W Cypress St
Your Personal Tour Guide
Ask me questions while you tour the home.