Estimated Value: $850,000 - $971,000
7
Beds
3
Baths
2,602
Sq Ft
$356/Sq Ft
Est. Value
About This Home
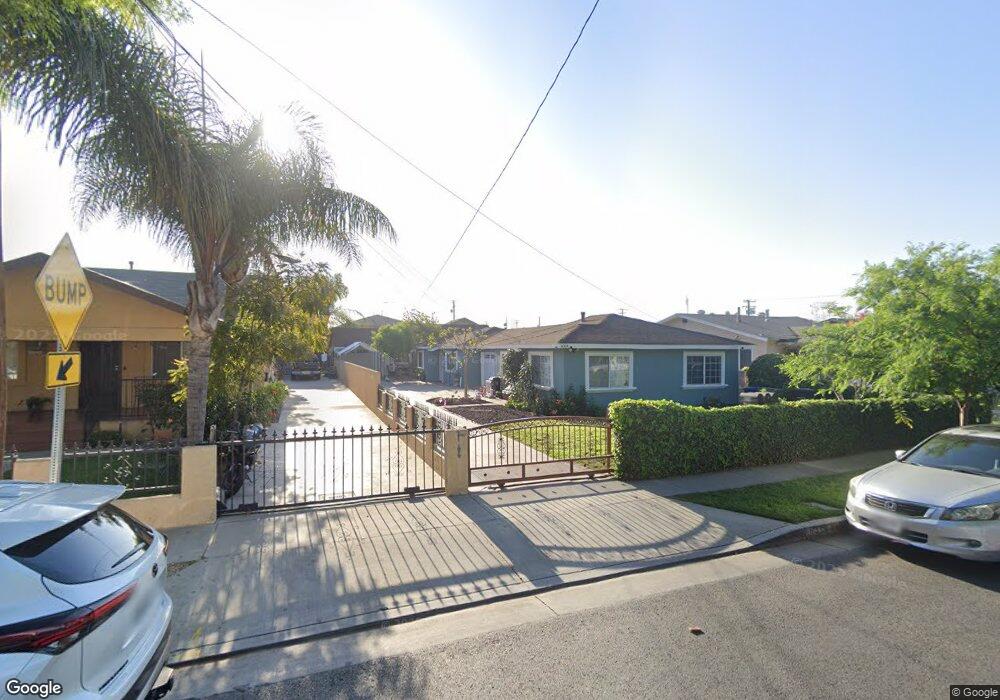
This home is located at 6314 Riverside Ave, Bell, CA 90201 and is currently estimated at $925,667, approximately $355 per square foot. 6314 Riverside Ave is a home located in Los Angeles County with nearby schools including Corona Avenue Elementary School, Orchard Academies 2b School, and Maywood Academy High School.
Ownership History
Date
Name
Owned For
Owner Type
Purchase Details
Closed on
Apr 12, 2018
Sold by
Ruiz Leticia
Bought by
Ruiz Leticia and Leticia Ruiz Trust
Current Estimated Value
Purchase Details
Closed on
Jun 30, 2014
Sold by
Ruiz Jose S and Ruz Samuel
Bought by
Ruiz Leticia
Purchase Details
Closed on
Mar 15, 2008
Sold by
Ruiz Patricia
Bought by
Ruiz Samuel
Purchase Details
Closed on
Mar 13, 2008
Sold by
Ruiz Jose Salvador and Ruiz Leticia
Bought by
Ruiz Jose S and Ruiz Samuel
Purchase Details
Closed on
Apr 5, 1999
Sold by
Ruiz Maria G
Bought by
Ruiz Jose Salvador and Ruiz Leticia
Home Financials for this Owner
Home Financials are based on the most recent Mortgage that was taken out on this home.
Original Mortgage
$100,000
Interest Rate
6.91%
Purchase Details
Closed on
Oct 23, 1997
Sold by
Ruiz Froy Lan and Ruiz Guadalupe
Bought by
Ruiz Jose Salvador and Ruiz Leticia
Create a Home Valuation Report for This Property
The Home Valuation Report is an in-depth analysis detailing your home's value as well as a comparison with similar homes in the area
Home Values in the Area
Average Home Value in this Area
Purchase History
| Date | Buyer | Sale Price | Title Company |
|---|---|---|---|
| Ruiz Leticia | -- | None Available | |
| Ruiz Leticia | -- | None Available | |
| Ruiz Samuel | -- | None Available | |
| Ruiz Jose S | -- | None Available | |
| Ruiz Jose Salvador | -- | North American Title | |
| Ruiz Jose Salvador | -- | -- |
Source: Public Records
Mortgage History
| Date | Status | Borrower | Loan Amount |
|---|---|---|---|
| Closed | Ruiz Jose Salvador | $100,000 |
Source: Public Records
Tax History
| Year | Tax Paid | Tax Assessment Tax Assessment Total Assessment is a certain percentage of the fair market value that is determined by local assessors to be the total taxable value of land and additions on the property. | Land | Improvement |
|---|---|---|---|---|
| 2025 | $5,795 | $329,734 | $136,677 | $193,057 |
| 2024 | $5,795 | $323,270 | $133,998 | $189,272 |
| 2023 | $5,698 | $316,932 | $131,371 | $185,561 |
| 2022 | $5,490 | $310,719 | $128,796 | $181,923 |
| 2021 | $5,424 | $304,627 | $126,271 | $178,356 |
| 2020 | $5,443 | $301,505 | $124,977 | $176,528 |
| 2019 | $5,270 | $295,594 | $122,527 | $173,067 |
| 2018 | $5,084 | $289,799 | $120,125 | $169,674 |
| 2016 | $4,976 | $278,548 | $115,461 | $163,087 |
| 2015 | $4,900 | $274,365 | $113,727 | $160,638 |
| 2014 | $4,891 | $268,992 | $111,500 | $157,492 |
Source: Public Records
Map
Nearby Homes
- 4026 Gage Ave
- 6623 Gifford Ave
- 4020 E 61st St
- 6600 Fishburn Ave
- 6522 Bear Ave
- 6072 Gifford Ave
- 3602 Randolph Place
- 4301 E 60th St
- 4212 E 58th St
- 3510 Nevada St
- 6048 King Ave
- 6509 Prospect Ave
- 3561 Beck Ave
- 3519 E 60th St
- 4101 E 57th St
- 3427 Bell Ave
- 7105 California Ave
- 3725 E 57th St
- 6221 Heliotrope Ave
- 6837 Mayflower Ave
- 6310 Riverside Ave
- 6320 Riverside Ave
- 6306 Riverside Ave
- 6324 Riverside Ave
- 6300 Riverside Ave
- 6330 Riverside Ave
- 6315 Gifford Ave
- 6309 Gifford Ave
- 6319 Gifford Ave
- 6305 Gifford Ave
- 6325 Gifford Ave
- 6336 Riverside Ave
- 6254 Riverside Ave
- 6317 Riverside Ave
- 6321 Riverside Ave
- 6311 Riverside Ave
- 6301 Gifford Ave
- 6331 Gifford Ave
- 6325 Riverside Ave
- 6307 Riverside Ave
Your Personal Tour Guide
Ask me questions while you tour the home.