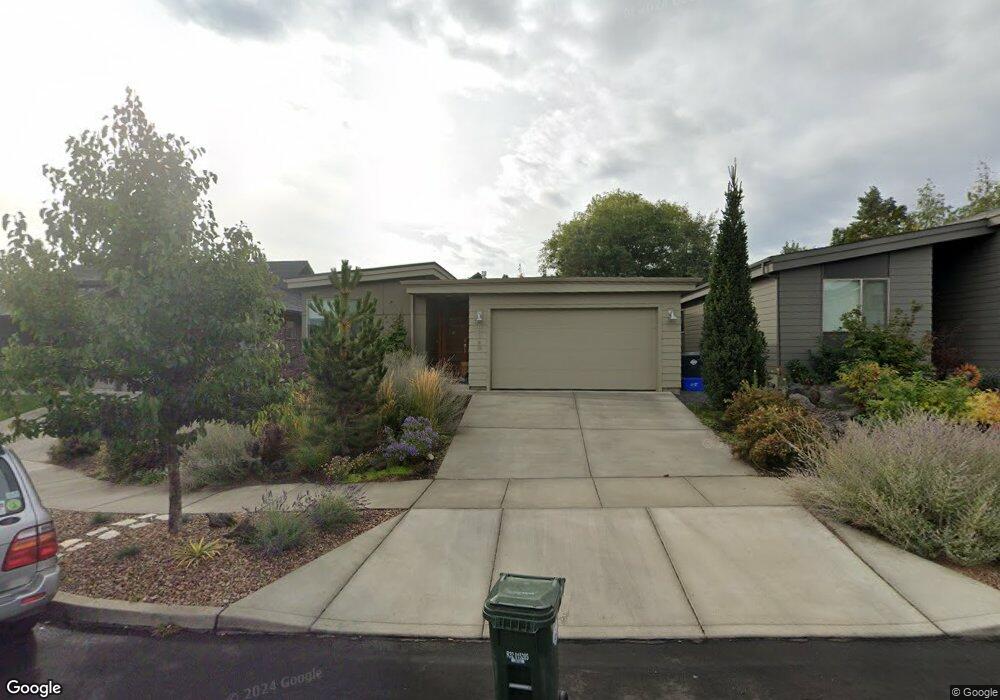
63149 Iner Loop Bend, OR 97701
Boyd Acres NeighborhoodEstimated Value: $592,324 - $729,000
3
Beds
2
Baths
1,557
Sq Ft
$418/Sq Ft
Est. Value
About This Home
This home is located at 63149 Iner Loop, Bend, OR 97701 and is currently estimated at $651,331, approximately $418 per square foot. 63149 Iner Loop is a home located in Deschutes County with nearby schools including Lava Ridge Elementary School, Sky View Middle School, and Mountain View Senior High School.
Ownership History
Date
Name
Owned For
Owner Type
Purchase Details
Closed on
Aug 25, 2023
Sold by
Bravard John D
Bought by
Bennett Lesley A and Dooley Jeffrey E
Current Estimated Value
Home Financials for this Owner
Home Financials are based on the most recent Mortgage that was taken out on this home.
Original Mortgage
$230,000
Outstanding Balance
$224,046
Interest Rate
6.78%
Mortgage Type
New Conventional
Estimated Equity
$427,285
Purchase Details
Closed on
Sep 25, 2017
Sold by
Flowering Crabapple Llc
Bought by
Bravard John D and Calme Virginie E
Home Financials for this Owner
Home Financials are based on the most recent Mortgage that was taken out on this home.
Original Mortgage
$239,000
Interest Rate
3.89%
Mortgage Type
New Conventional
Purchase Details
Closed on
Feb 5, 2014
Sold by
Nmv Estates Llc
Bought by
Flowering Crabapple Llc
Home Financials for this Owner
Home Financials are based on the most recent Mortgage that was taken out on this home.
Original Mortgage
$286,572
Interest Rate
4.08%
Mortgage Type
Credit Line Revolving
Create a Home Valuation Report for This Property
The Home Valuation Report is an in-depth analysis detailing your home's value as well as a comparison with similar homes in the area
Home Values in the Area
Average Home Value in this Area
Purchase History
| Date | Buyer | Sale Price | Title Company |
|---|---|---|---|
| Bennett Lesley A | $675,000 | Western Title | |
| Bravard John D | $409,000 | Fidelity Natl Title Co Of Or | |
| Flowering Crabapple Llc | $50,000 | Amerititle |
Source: Public Records
Mortgage History
| Date | Status | Borrower | Loan Amount |
|---|---|---|---|
| Open | Bennett Lesley A | $230,000 | |
| Previous Owner | Bravard John D | $239,000 | |
| Previous Owner | Flowering Crabapple Llc | $286,572 |
Source: Public Records
Tax History
| Year | Tax Paid | Tax Assessment Tax Assessment Total Assessment is a certain percentage of the fair market value that is determined by local assessors to be the total taxable value of land and additions on the property. | Land | Improvement |
|---|---|---|---|---|
| 2025 | $4,078 | $241,370 | -- | -- |
| 2024 | $3,924 | $234,340 | -- | -- |
| 2023 | $3,637 | $227,520 | $0 | $0 |
| 2022 | $3,394 | $214,470 | $0 | $0 |
| 2021 | $3,399 | $208,230 | $0 | $0 |
| 2020 | $3,225 | $208,230 | $0 | $0 |
| 2019 | $3,135 | $202,170 | $0 | $0 |
| 2018 | $3,046 | $196,290 | $0 | $0 |
| 2017 | $627 | $40,440 | $0 | $0 |
| 2016 | $599 | $39,270 | $0 | $0 |
| 2015 | $582 | $38,130 | $0 | $0 |
| 2014 | $565 | $37,020 | $0 | $0 |
Source: Public Records
Map
Nearby Homes
- 20583 Sierra Dr
- 63182 Iner Loop
- 63163 Boyd Acres Rd
- 20560 Boyd Ct
- 20585 Fred Meyers Rd
- 20551 Gloucester Ln
- 20668 Blanca Dr
- 20532 NE Empire Ave
- 20534 Empire Ave
- 20528 NE Empire Ave
- 20570 Fred Meyers Rd
- 20530 NE Empire Ave
- 63197 Carly Ln
- 20514 NE Empire Ave
- 20695 Town Dr Unit LOT 81
- 20695 Town Dr
- 63190 Carly Ln
- 63217 Carly Ln
- 63206 Carly Ln
- 63150 Peale St
- 63149 Iner Loop
- 63153 Inner Loop
- 63153 Iner Loop
- 63145 Iner Loop
- 63145 Iner Loop
- 63157 Inner Loop
- 63157 Iner Loop
- 20592 Sierra Dr
- 20588 Sierra Dr
- 20588 NE Sierra Dr
- 63141 Iner Loop
- 63161 Iner Loop
- 63141 Inner Loop
- 63161 Iner Loop
- 63150 NE Iner Loop
- 63150 Iner Loop
- 3 Iner Loop
- 34 Iner Loop
- 13 Iner Loop
Your Personal Tour Guide
Ask me questions while you tour the home.