Estimated Value: $940,426 - $988,000
4
Beds
3
Baths
2,468
Sq Ft
$391/Sq Ft
Est. Value
About This Home
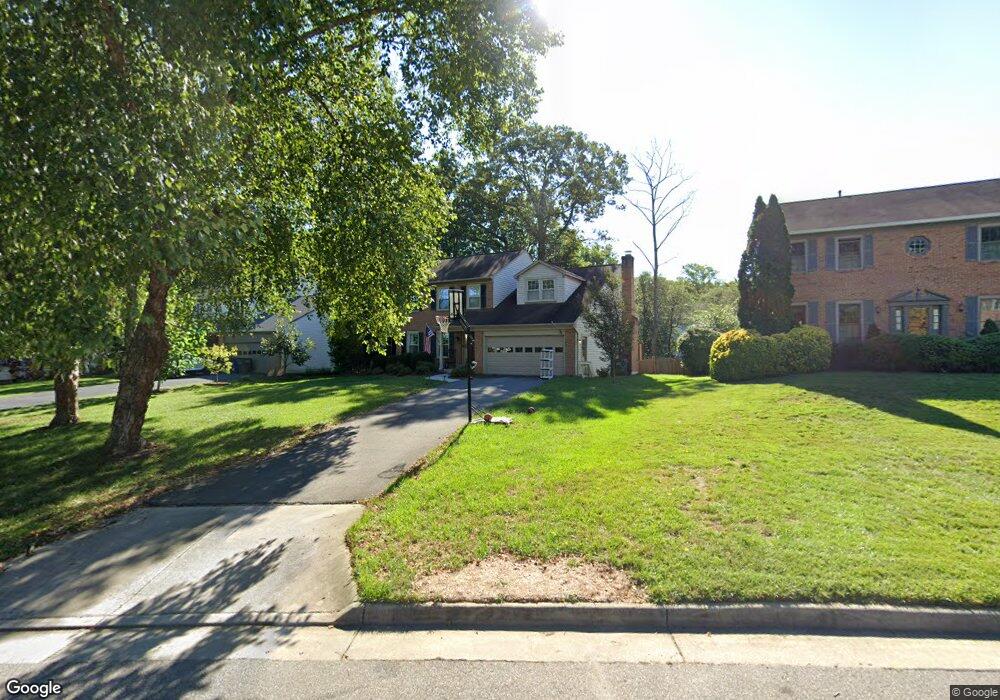
This home is located at 6315 Summerday Ct, Burke, VA 22015 and is currently estimated at $964,857, approximately $390 per square foot. 6315 Summerday Ct is a home located in Fairfax County with nearby schools including Cherry Run Elementary School, Lake Braddock Secondary School, and Nativity Catholic School.
Ownership History
Date
Name
Owned For
Owner Type
Purchase Details
Closed on
Jun 23, 2016
Sold by
Quigley Erik N and Quigley Laurie M
Bought by
Morgan Ryan J and Morgan Michelle A
Current Estimated Value
Home Financials for this Owner
Home Financials are based on the most recent Mortgage that was taken out on this home.
Original Mortgage
$550,000
Outstanding Balance
$437,882
Interest Rate
3.58%
Mortgage Type
New Conventional
Estimated Equity
$526,976
Purchase Details
Closed on
Jan 29, 2010
Sold by
Shankle Howard W
Bought by
Quigley Erik N
Home Financials for this Owner
Home Financials are based on the most recent Mortgage that was taken out on this home.
Original Mortgage
$561,101
Interest Rate
4.95%
Mortgage Type
VA
Create a Home Valuation Report for This Property
The Home Valuation Report is an in-depth analysis detailing your home's value as well as a comparison with similar homes in the area
Home Values in the Area
Average Home Value in this Area
Purchase History
| Date | Buyer | Sale Price | Title Company |
|---|---|---|---|
| Morgan Ryan J | $650,000 | Nva Title Inc | |
| Quigley Erik N | $550,000 | -- |
Source: Public Records
Mortgage History
| Date | Status | Borrower | Loan Amount |
|---|---|---|---|
| Open | Morgan Ryan J | $550,000 | |
| Previous Owner | Quigley Erik N | $561,101 |
Source: Public Records
Tax History Compared to Growth
Tax History
| Year | Tax Paid | Tax Assessment Tax Assessment Total Assessment is a certain percentage of the fair market value that is determined by local assessors to be the total taxable value of land and additions on the property. | Land | Improvement |
|---|---|---|---|---|
| 2025 | $9,915 | $924,110 | $330,000 | $594,110 |
| 2024 | $9,915 | $855,850 | $300,000 | $555,850 |
| 2023 | $9,305 | $824,570 | $290,000 | $534,570 |
| 2022 | $8,942 | $781,950 | $270,000 | $511,950 |
| 2021 | $8,224 | $700,830 | $235,000 | $465,830 |
| 2020 | $7,718 | $652,100 | $215,000 | $437,100 |
| 2019 | $7,557 | $638,530 | $210,000 | $428,530 |
| 2018 | $7,247 | $630,130 | $210,000 | $420,130 |
| 2017 | $7,501 | $646,090 | $210,000 | $436,090 |
| 2016 | $7,485 | $646,090 | $210,000 | $436,090 |
| 2015 | $7,210 | $646,090 | $210,000 | $436,090 |
| 2014 | $7,165 | $643,510 | $210,000 | $433,510 |
Source: Public Records
Map
Nearby Homes
- 9715 Church Way
- 10124 Lakehaven Ct
- 9983 Hemlock Woods Ln
- 9523 Cherry Oak Ct
- 9521 Cherry Oak Ct
- 9505 Scorpio Ln
- 9515 Debra Spradlin Ct
- 9814 Natick Rd
- 6003 Lincolnwood Ct
- 5922 New England Woods Dr
- 5947 New England Woods Dr
- 10205 Quiet Pond Terrace
- 9472 Lapstrake Ln
- 5838 High Bluff Ct
- 5976 Annaberg Place Unit 168
- 6314 Draco St
- 9175 Broken Oak Place Unit 39B
- 6154 Martins Landing Ct
- 6311 Fenestra Ct Unit 137B
- 10330 Luria Commons Ct Unit 1B
- 6313 Summerday Ct
- 6317 Summerday Ct
- 9818 Summerday Dr
- 9816 Summerday Dr
- 6311 Summerday Ct
- 6319 Summerday Ct
- 6309 Summerday Ct
- 9820 Summerday Dr
- 6310 Summerday Ct
- 6318 Summerday Ct
- 9814 Summerday Dr
- 6321 Summerday Ct
- 6307 Summerday Ct
- 9822 Summerday Dr
- 6306 Summerday Ct
- 6324 Summerday Ct
- 9812 Summerday Dr
- 9817 Summerday Dr
- 6323 Summerday Ct
- 9815 Summerday Dr